
By Teresa Zhang, VP of operations and Paul Grana, co-founder, Folsom Labs
Specific yield (kWh/kWp) is one of the most commonly used performance metrics for solar systems of all sizes. It’s used to compare different locations, to analyze different designs or to assess the health of an array. As the team behind HelioScope, we are frequently asked, “What’s a good value for kWh/kWp?” The answer is, as with many solar design questions, it depends.
In this article, we discuss the factors that drive specific yield up or down and present typical kWh/kWp values for a variety of locations, weather data sources and representative designs.
Factors that impact specific yield
Specific yield (or simply “yield”) refers to how much energy (kWh) is produced for every kWp of module capacity over the course of a typical or actual year. While typical values can range from 1,000 kWh/kWp to over 2,000 kWh/kWp, the actual value is driven by many factors, including:
- Location. A project’s location determines the amount of sunlight, or irradiance, it will receive. Irradiance is usually the biggest driver of specific yield because irradiance can vary so much. For example, El Paso, Texas, gets twice the annual global horizontal irradiance (GHI) as mountainous areas of Washington or Montana. Irradiance depends directly on the location of an array, as well as on other factors related to location, such as the array’s exposure to shade, soiling and snow cover.
- Weather file. There are a number of different ways of constructing a weather file, including ground-based measurements, satellite-based models and hybrid approaches. These different methodologies can result in weather files that differ by 10% or more for the same location and the same period of time.
- Module orientation. The module tilt and azimuth impact how much of the available sunlight (GHI) will actually hit the surface of the array (also known as plane-of-array or POA irradiance). The POA gain from tilting modules from horizontal to a tilt of 18° can, for example, range from 8% in Miami, Florida, to over 20% in Anchorage, Alaska.
- Module selection. Modules are often described by a single number—module wattage. But in terms of energy per watt, not all modules are created equal. All modules lose efficiency in hot and low-light conditions, but they lose efficiency at different rates. Temperature performance in particular can make a real difference; a module with a better temperature coefficient can improve the yield of a project by as much as 2-4%.
- Balance of system efficiency. BOS efficiency includes inverter efficiency, inverter clipping, MPP tracking losses, DC and AC wire losses, mismatch losses and more. Many energy production model tools simply assume a fixed value for system losses, but HelioScope rigorously models each system loss for every hour of the year. See Figure 1 below for a sample graph of system losses from HelioScope.
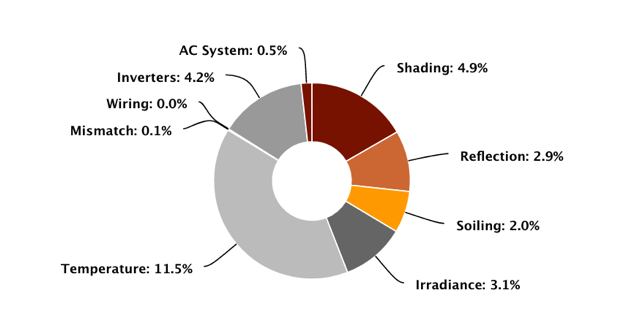
Figure 1: Typical system losses for a residential project in Columbia, South Carolina.
Typical kWh/kWp values
Now that we’ve defined the drivers of yield, let’s drill down to yield values for a couple of real examples to see how location, weather file and design individually impact yield, starting with location. Figure 2 shows GHI for four representative locations, as reported by NREL Solar Prospector.
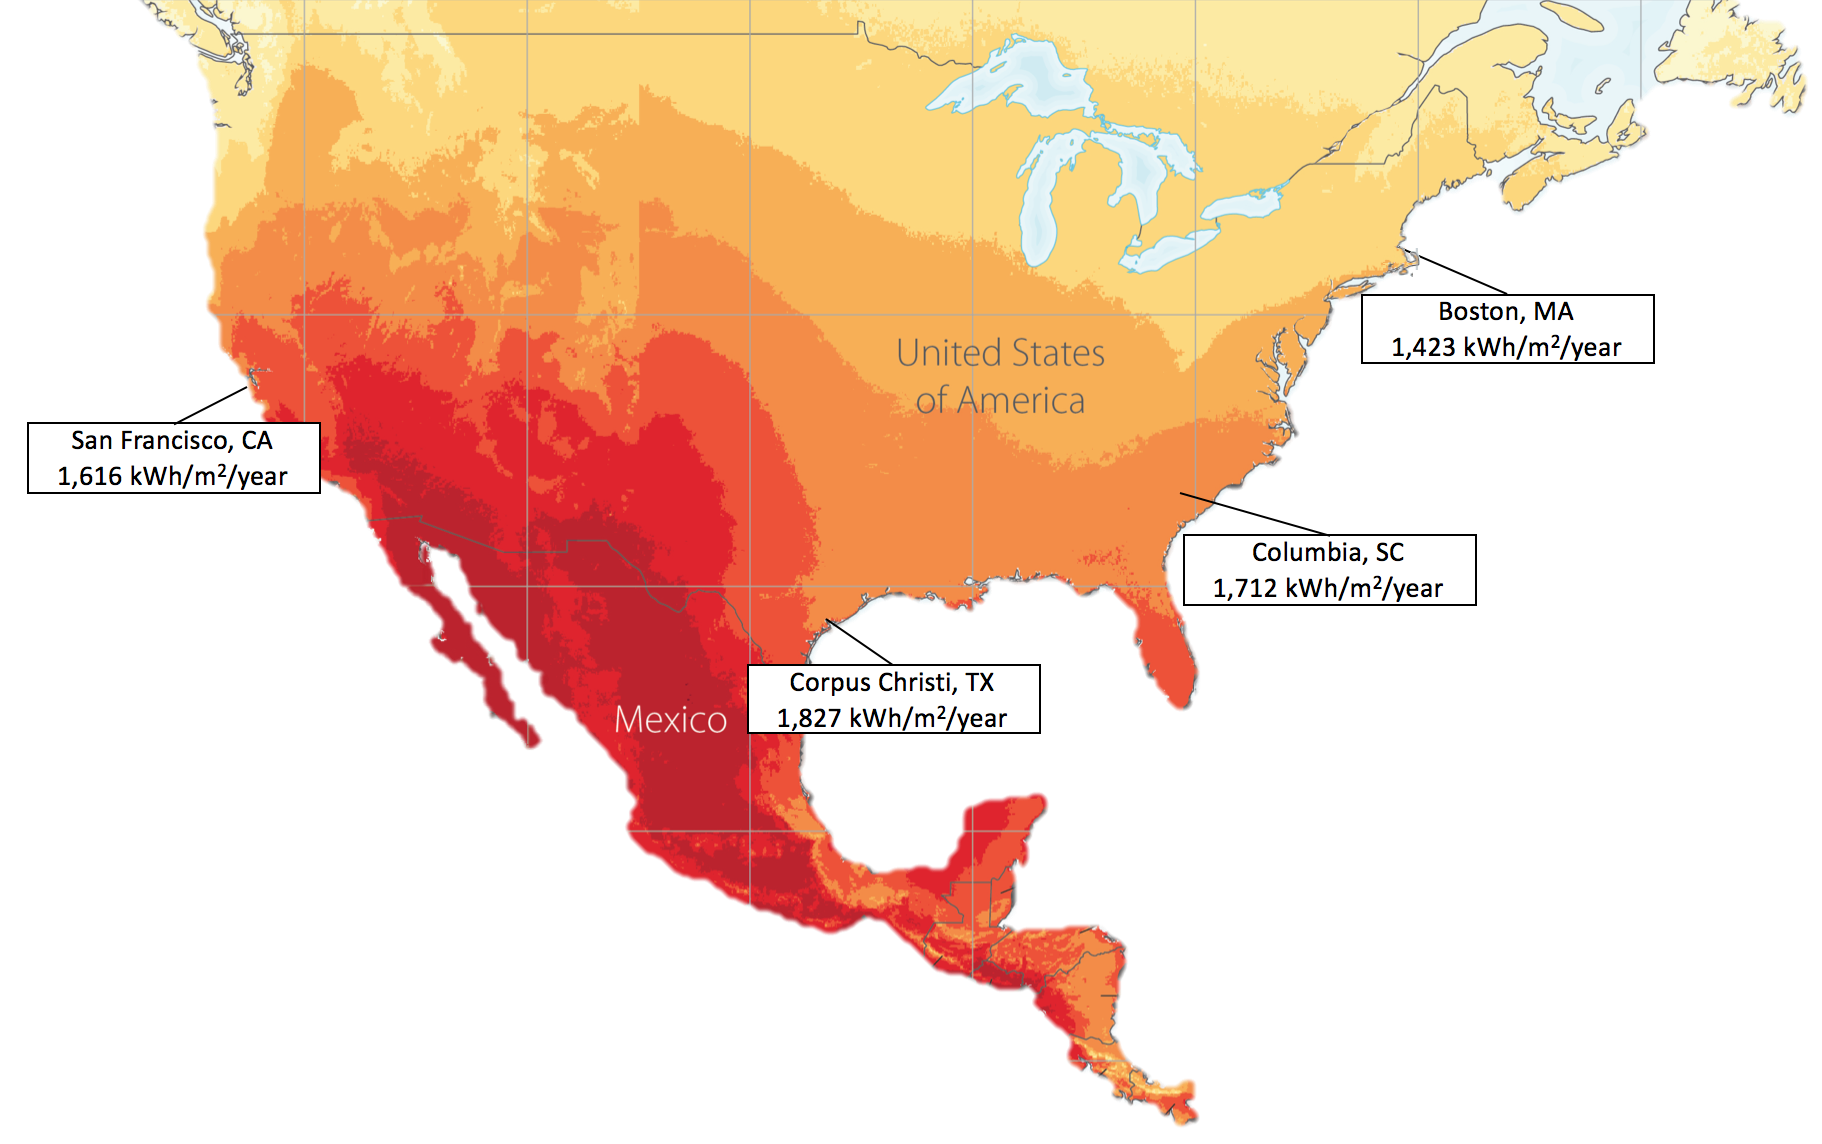
Figure 2: GHI values for four representative locations (Image courtesy of NREL).
For any given location, you may have access to a number of weather files. In Figure 3, you can see that different sources of weather data report different irradiance values for the same location, and that the ranking of values reported by different weather file sources is not consistent from location to location.
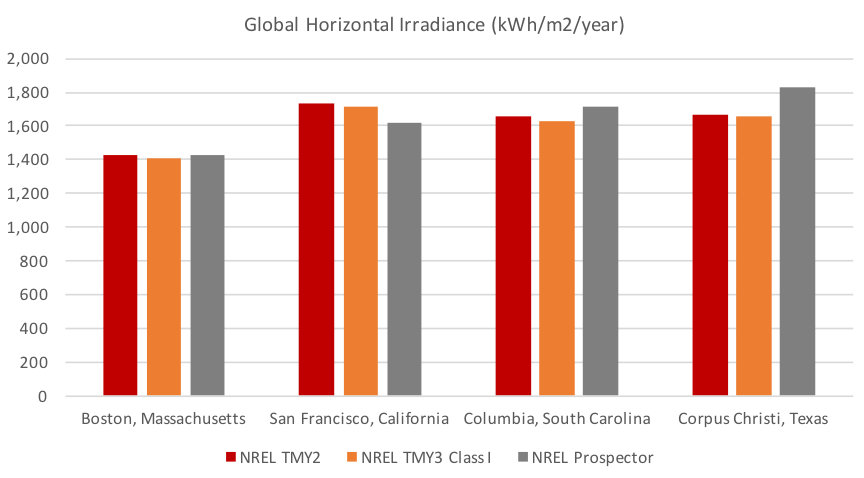
Figure 3: GHI values from three source of weather data.
Finally, design is usually the biggest driver of yield at your control. While there are infinite design options, we’ll stick to five representative designs, as shown in Table 1.
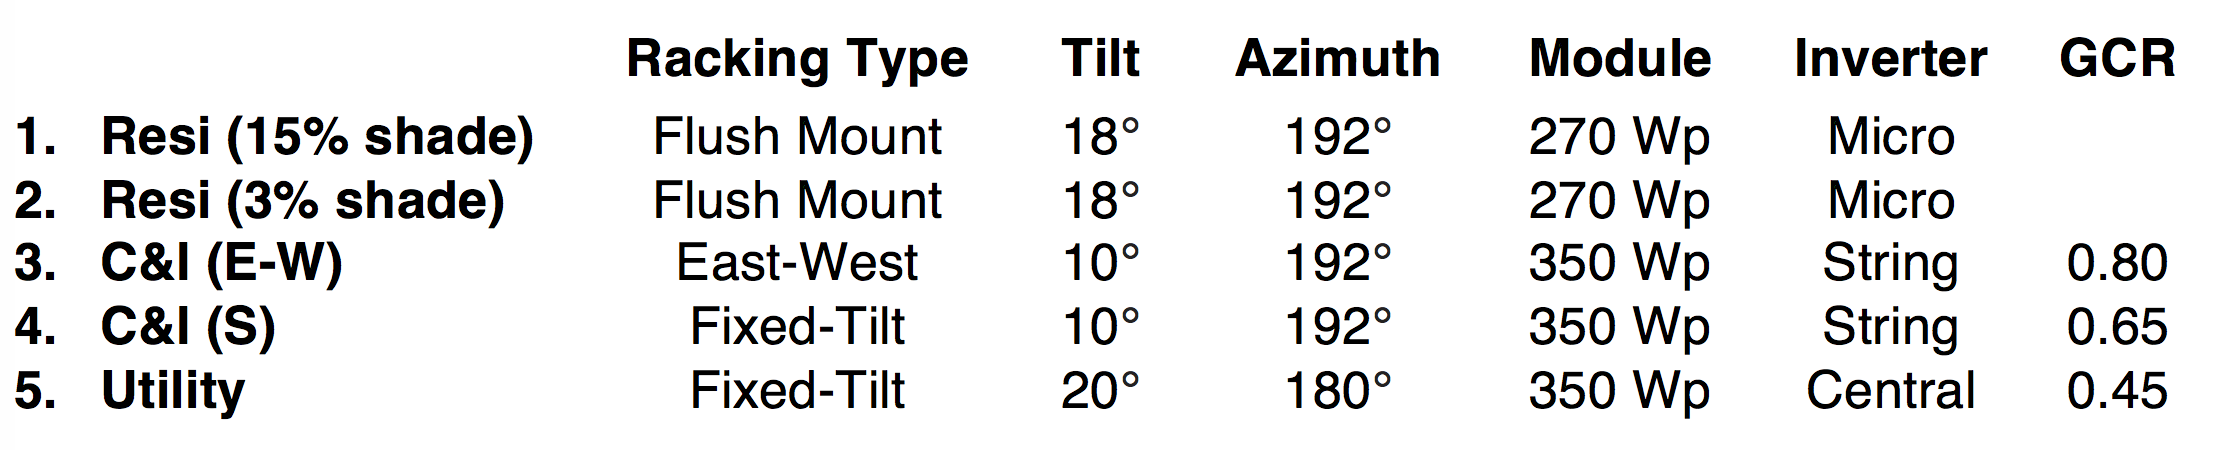
Table 1: Four typical system designs
Table 2 shows yield values for these designs in four representative locations:
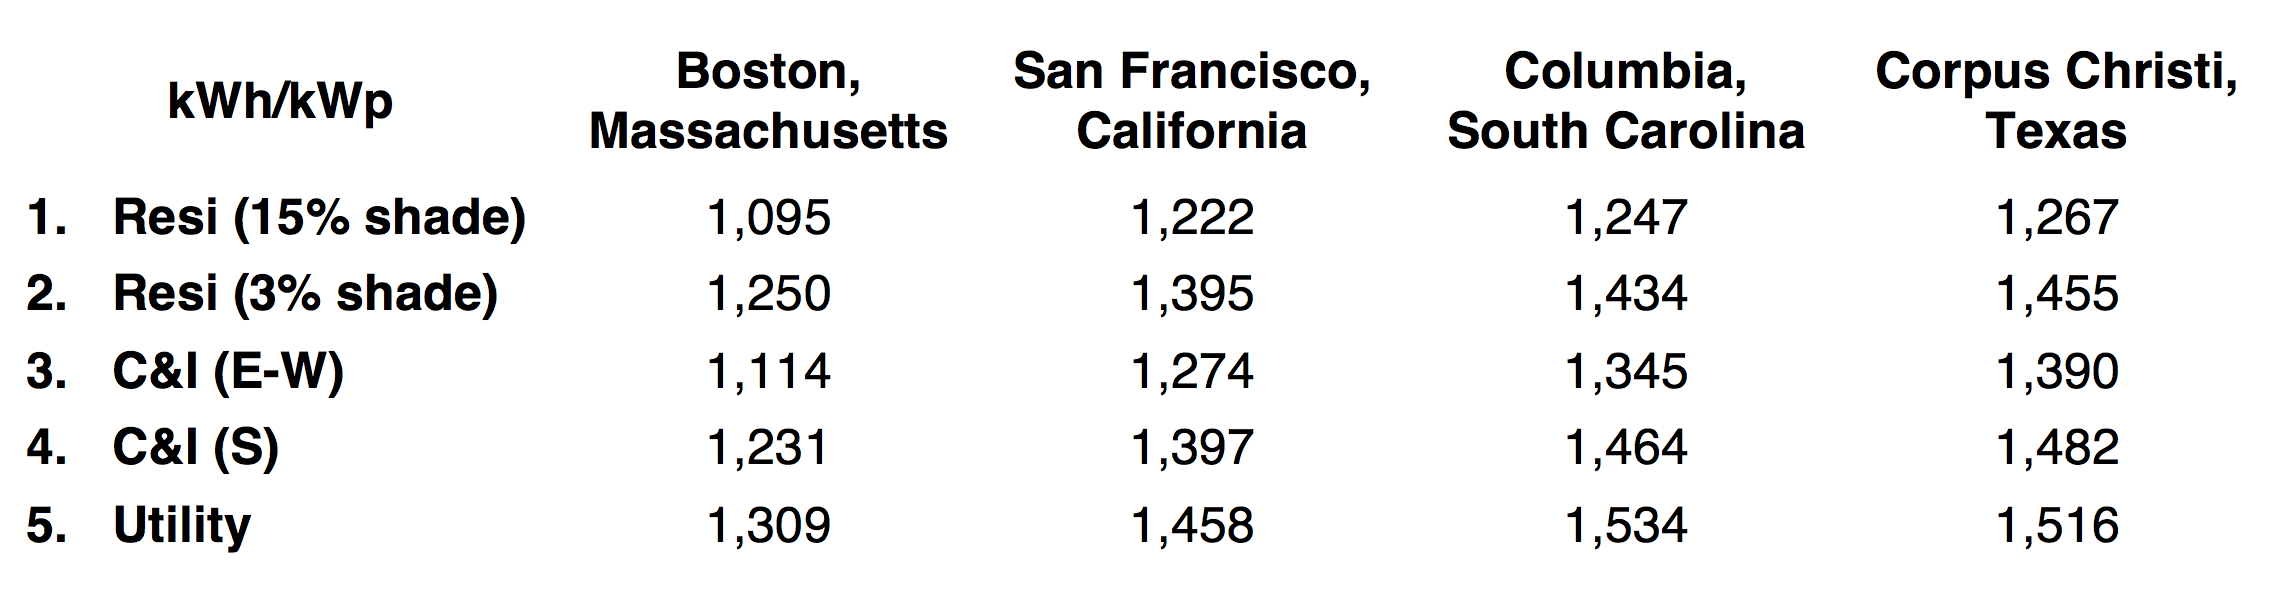
Table 2: Yield values for four representative designs in four representative locations
In each location, there’s a difference of 20% or more between the lowest yield design and the highest yield design (that is, between the high-shade residential design and the utility design). All of these designs have different impacts of shading, temperature and even plane-of-array orientation adjustments.
Many solar developers have a sense for the kWh/kWp yield they expect to see based on their own history. But not many appreciate how those will vary based on the location, the system type or even the weather file used. As with everything in solar, the devil is in the details!
Teresa Zhang is VP of operations at Folsom Labs. She is an engineer, environmentalist, and expert witness with a decade of experience in solar, spanning module manufacturing, project development, technical due diligence, and software. She holds BS and PhD degrees in mechanical engineering from MIT and U.C. Berkeley.

I guess I don’t get it or understand it.
My system produces 65 kWh a day and my app
Says a specific yield of 2.64 kWh/kwp a day What am I looking at and what does it mean. Good/Bad.
Hi…
I need to know what size panels u have have and how many..
The unit of measure for Specific Yield (SY) is %.
So… SY : 2.64% = kWh/Kwp
2.64% = 65kWh/Kwp
So…Kwp = 65kWh/2.64
Kwp = 24.6
Please define or explain “Average yield expectations [kWh]” I see this on my output graph but my solar actual is never near this number even on full sunny day in summer hours.
Hi,
I am trying to figure it all out myself I am based in Ireland and was sent a data sheet with some kwh/kwp?
Production Forecast;
Pv Generator output 100.10 kWp
Spec. Annual Yield 836.09 kWh/kWp
Could someone this to explain to me?
Thanks
i know the answer is too late, but anyways…
The nominal power (kWp) is the power of the PV system under standardized conditions (solar irradiation of 1,000 watts per square meter at a temperature of 25 °C). This is measured in kWp (kilowatt peak). So here a 200Wp panel would produce 200Wh.
The rated power is given so that solar panels can be compared.
In most cases, the nominal power is higher than the actual yield; after all, in practice, weather-related influences or the orientation of the PV system play a role.
.
Your PV system will produce less energy than a similar system under standardized conditions. Among other things, you live too far north.
However, I think the average yield in Ireland is 800kWh/kWp, so your system would already perform decently.
I think when you mention specific yield it’s also important to state duration because it is the energy yielded per unit installed capacity over time. So saying 2000kWh/kWp or even 120% is a bit ambiguous.
yearly
for my solar design which data should be taken out of global irradiance, direct normal irradiance or specific yield?
Is specific yield ,which is found on data site , associates for a particular type of pv panel ?
Awesome writeup and detail on yield. Thank you! This is the type of transparency we need in solar and clean energy.
Although not stated, I assume the formula is:
specific yield = energy produced in one year [kWh] / rated power of system [kW]
Therefore, the unit of specific yield is hour [h].
Furthermore, it seems easier to me to think of it as the number of hours per year at which the system effectively operates at its rated power.
Very good idea. Hours of rated system output seems a simple and effective measure.
It could be refined by using cloudless sky days for the four seasons as bench marks.
A cloudless day would be defined by the ideal shape of the PV generation curve
Ya, I agree with Daniel. KWH/m2 is also called Peak Sun Hour of a PV location
Specific yield = PSH * various de-rating factors of PV system
is 2000 kwh/kwp good pv out put
Yes. Think of the kwh/kwp (or just kw) as the power produced per nameplate. So 1050 is like getting 105% of the nameplate rating of the panel. If you get 950, you’re at 95%.
In my area, NJ, 105-115 is a welcome sight, now and then get close to 120% (1200), and ground mounts in a field I can hit 125-130%. So if you’re getting 2000 I’d like to hear about it! Unless you have dual-axis trackers, I was involved with a few of them and we were getting 200% (your 2000).
I needed to ask how can we calculate the mean value ratio for a specific inverter?
And how to set the mean value threshold for each inverter?
One question: why is kWh/m2 equivalent to kWh/kWp?
It’s not equivalent, Francesco. kWh/m2 is irradiance and kWh/kWp is specific yield