
Demand from hyperscalers and data centers is rising quickly, while interconnection delays are stretching multiple years across utilities. As a result, commercial and industrial customers and large energy buyers are turning to one of the few resources that can be built and energized quickly, which is battery energy storage systems (BESS).
The economics of BESS are becoming more favorable. Lithium iron phosphate (LFP) container costs, which were between $300 and $400/kWh in the early 2010s, declined to $180 and $250/kWh by 2023, and are expected to fall below $100/kWh within the next five to six years. Ember’s October 2025 market assessment estimates all-in project capital expenditures for utility scale projects — those greater than 100 MW — outside China and the United States at roughly $125/kWh.
This headline figure has given customers reason to believe that optimized battery projects can address their energy challenges.
CapEx tells only part of the story
For a standard battery project, equipment typically represents 65 to 75% of the cost. The remaining 25 to 35% covers the infrastructure and site work needed to turn that hardware into an operating asset, including the point of interconnection, transformer count, switchgear ratings, protection systems and civil work. Under stable ground conditions, with no grading or subsurface issues, equipment choices alone can shift total project cost by 7 to 12%.
But even when highly optimized, this only shows what was paid upfront, not what the electricity delivered by the battery will cost. This can be calculated with the help of levelized cost of storage (LCOS): the present value of all lifetime costs divided by the present value of all lifetime energy delivered. LCOS provides the same analogy as the utility bill rate — the U.S. residential average is about 18.55¢ /kWh — and it is this metric that can fairly compare battery project cost in different applications and with technologies.
Before reviewing the calculation, it is important to clarify how LCOS is being measured. Some models define LCOS as the cost of shifting one megawatt-hour to another hour and exclude the electricity used to charge the battery. Other approaches measure the cost of discharging one megawatt-hour and include the charging cost. The appropriate model should be used when evaluating project feasibility.
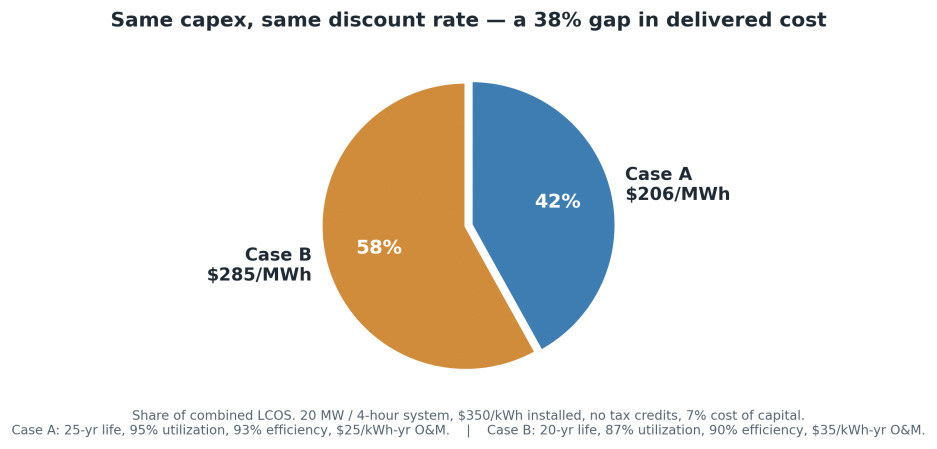
Case A vs. Case B levelized cost of storage.
Example LCOS case: Key assumptions and results
Published LCOS estimates vary widely because they are driven more by underlying assumptions rather than technology alone. For example, the U.S. Energy Information Administration models storage entering service in 2030 over a 30-year recovery period with a 6.65% cost of capital and reports a $126/MWh LCOS. By comparison, Lazard’s Levelized Cost of Storage v11.0 estimates a 100-MW, four-hour standalone system at $210 to $292/MWh on an unsubsidized basis.
The gap between $126 and $292 is not a disagreement about batteries or the system size. Lazard’s estimation includes assumptions such as charging cost, an 80% equity at a 12% return and augmenting prices in capacity to offset degradation. Both estimations are plausible; cheaper hardware is not what moved that number, but better assumptions did.
Six key inputs and their impact
The first key input is project life. These projects are expected to operate 15 to 25 years, depending on performance guarantees and cycle warranties. Modern LFP guarantees commonly run 20 to 25 years or 10,000 to 12,000 cycles.
The second is discount rate/cost of capital. Contracted projects with predictable cash flow support a 6 to 8% rate. Merchant projects face 10 to 15%. This can also change based on an entity’s financial credibility.
The third is round-trip efficiency. This is specific to a manufacturer. Tesla Megapack 3 delivers roughly 93% round-trip efficiency at four hours, and Sungrow quotes into the mid-90s.
The fourth is utilization. Long-duration systems rarely exceed one cycle per day. Three hundred to 350 cycles per year is standard across the application resulting in 80 to 90% utilization range.
The fifth key input is degradation, which is typically, 1 to 2.5% annually. At 2%, usable capacity lands near 65% of nameplate after 20 years. Manufacturers provide this along with the project quote.
The fifth and final input is operating cost. Having no moving parts and with manufacturer-backed performance guarantees and warranties, operating costs are generally on the lower end. However, they can vary significantly by technology and system size. As per Lazard, for utility-scale four-hour systems it’s in $3.75 to $7.75/kWh per year, but for a distributed generation project it can be around $30 to 50/kWh per year.
Two systems with the same CapEx and a 38% cost gap
Consider a 20-MW/four-hour energy storage project. Typical CapEx ranges from $350 to $420/kWh; our analysis will assume $350/kWh in both cases, with 1% cost escalation, 2% annual degradation and a 7% cost of capital and $40/MWh for charging cost. Here are two different energy storage project scenarios to consider:
Case A: A 25-year life, 95% utilization, 93% round-trip efficiency and $25/kWh per year in operating cost produce an LCOS of $206/MWh.
Case B: Using the same capex but assuming a 20-year life, 87% utilization, 90% round-trip efficiency, and $35/kWh-year in operating cost increases LCOS to $285/MWh.
This is the same equipment, same installed price, same discount rate, but a 38% difference in delivered cost/LCOS, worth roughly $79 on every megawatt-hour the asset ever discharges. That is millions of dollars in lifetime value, decided entirely by parameters that never appear on a CapEx line item.
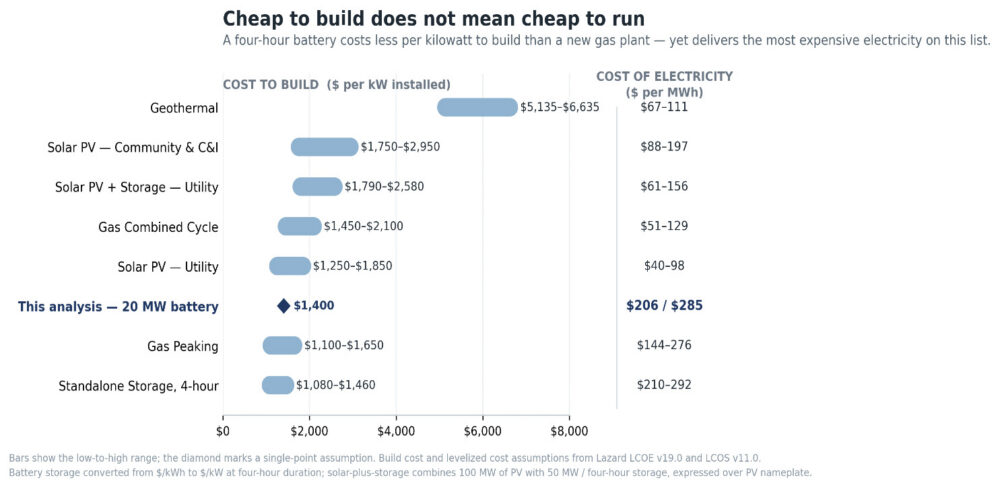
Credit: Lazard LCOE+, LCOE v.19.0 and LCOS v11.0.
Behind-the-meter battery systems: Value beyond the LCOS number
Ember notes that storage added to an existing solar plant or behind the meter can make grid connection costs negligible, removing the largest variable in the $50/kWh installation component.
As demand charges are billed in dollars per kilowatt, not dollars per kilowatt-hour, a battery that shaves 20 peak minutes a month produces savings that never appear in an LCOS calculation, or which can be additionally added Battery systems can also provide benefits such as energy arbitrage, wholesale demand response, frequency regulation, spinning and non-spinning reserves and local incentives.
When a developer or supplier quotes battery CapEx for a project in dollars per kilowatt-hour, the key question is not just the lower CapEx number, but the assumptions behind it. Long-term feasibility depends on the warranty term, guaranteed efficiency curve, augmentation strategy and financing tied to the revenue contract.
Battery hardware is becoming increasingly commoditized; the factors that determine the true cost of delivered electricity are not. Buyers who negotiate only the CapEx line are optimizing the smaller part of the equation.



Tell Us What You Think!