
The latest “U.S. Solar Market Insight” report from SEIA and Wood Mackenzie, shows solar price increases across all market segments, largely attributed to trade policy uncertainty and supply chain constraints.
Ipsun Solar
The recently dismissed petitions for anti-dumping and countervailing duties on solar cells from Malaysia, Thailand, and Vietnam caused significant shipping disruptions for importers, which further exacerbated supply chain constraints. Logistical challenges and price increases in the solar supply chain will depress deployment over the next year, resulting in a 7.4 GW (25%) decrease in the forecast for 2022 compared to previous forecasts.
Solar projects will continue to face supply chain challenges in the near term, but new forecasts show that, if passed, the clean energy provisions in the Build Back Better Act will stimulate solar market growth. The legislation will enable the solar industry to continue on its robust growth trajectory, incentivize domestic manufacturing and alleviate supply chain constraints.
“The forecasts are clear: We must pass the Build Back Better Act to create quality American jobs, drive transformative solar and storage growth, and overcome supply chain bottlenecks,” said SEIA president and CEO Abigail Ross Hopper. “This legislation will help U.S. solar capacity triple over the next five years and offset an additional 83 million metric tons of carbon. Conversely, trade and supply chain headwinds will cause a significant decrease in installations next year at a time when more solar adoption is critical to addressing the climate crisis. This makes the domestic production provisions of the Build Back Better Act even more important to the future health of the U.S. industry.”
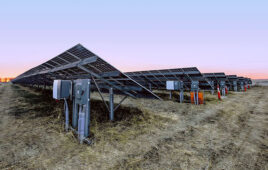
Rising prices are impacting the utility-scale solar market most. Prices in this segment dropped by 12% between Q1 2019 and Q1 2021, but spikes in the last six months have erased all price declines from this two-year period.
If the Build Back Better Act is enacted, the United States is projected to install 43.5 GW of additional solar capacity over the baseline forecast between 2022 and 2026. This would bring cumulative solar capacity in the United States to over 300 GW, which is triple the amount of solar deployed today.
“The U.S. solar market has never experienced this many opposing dynamics,” said Michelle Davis, principal analyst at Wood Mackenzie and lead author of the report. “On the one hand, supply chain constraints continue to escalate, putting gigawatts of projects at risk. On the other, the Build Back Better Act would be a major market stimulant for this industry, establishing long-term certainty of continued growth.”
Forecasts show that tax credits in the Build Back Better Act will increase growth in nascent state solar markets and significantly increase deployment in more established markets. For example, if the Build Back Better Act passes, Texas is expected to add 7 GW of additional solar capacity over the baseline forecast by 2026, reaching 44 GW of cumulative capacity.
If the Build Back Better Act becomes law, 14 states will see at least a 1-GW boost in solar deployment in the next five years, and 14 more will see at least a 500-MW boost.
Key Figures:
- Solar accounted for 54% of all new electricity-generating capacity added in the United States in the first three quarters of 2021.
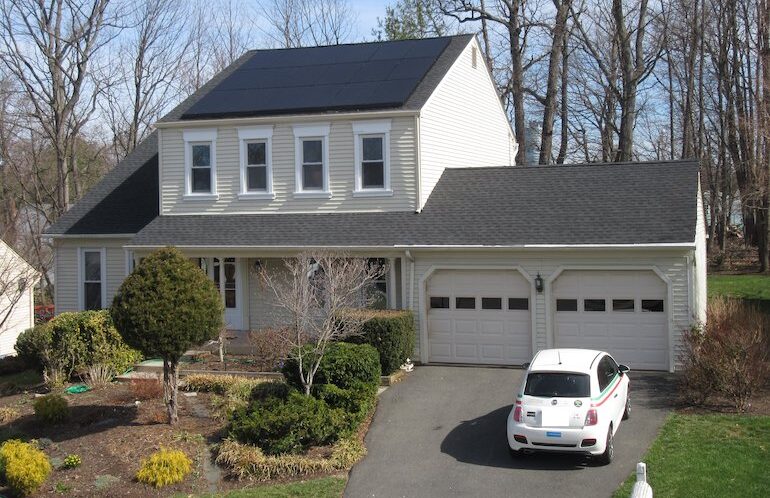
- Residential solar installations exceeded 1 GW and 130,000 systems in a single quarter for the first time, indicating that one out of every 600 U.S. homeowners is installing solar each quarter. Residential solar companies have fared better in the face of recent price increases, but tight module supply may impact future installations.
- Commercial and community solar fell 10% and 21% quarter-over-quarter, respectively. Major markets for these segments continue to experience interconnection and equipment delays.
- Due to supply chain constraints and logistics challenges, Wood Mackenzie has lowered its 2022 solar forecast by 25%, a decrease of 7.4 GW.
- Installed costs increased across all market segments for the second quarter in a row, reflecting supply chain challenges. In every segment besides residential, year-over-year price increases were at the highest they’ve been since 2014 when Wood Mackenzie began tracking pricing data.
News item from SEIA

“Residential solar installations exceeded 1 GW and 130,000 systems in a single quarter for the first time, indicating that one out of every 600 U.S. homeowners is installing solar each quarter.”
The bottom line here is more dependent on the overall experience of getting solar PV installed on one’s home and the seemingly endless problems getting all of the required inspections completed by county, city and local utility entities before the system is commissioned to be turned on. Many seem to be leaning on the didactic of “tariffs on foreign solar PV” and supply chain “constraints” as the reason. Even during the time of tariffs on some solar PV goods, adoption of solar PV still increased YOY and has vacillated between residential, commercial, light industrial and utility scale systems. In the residential arena I still see spaghetti regulations and ordinances creating a “soft costs” disparity from one region to another. Soft costs and bureaucracy is becoming an onerous cost to the adopters of solar PV and now ESS installation. These soft costs often are a point of “permitting” greed at the local level that has nothing to do with foreign goods and tariffs or supply chain constraints.
It’s beginning to look like “build back better” is going to become another layer of bureaucracy to navigate by current and potential solar PV installers from now on.
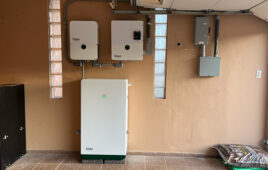
Do you have any figures for home battery storage?
I think the recent problems in Texas will help to increase uptake.