Solar Power World

  • Home
  • Top Solar Contractors
  • Solar+Storage
  • Articles
    • Most Recent Posts
    • News
      • Latest News Items
      • Solar tariffs
      • COVID-19 News
    • Featured
      • Latest Feature Stories
      • Contractors Corner
      • Installation Practices
      • Trends in Solar
      • Folsom Labs Solar Boot-Up
      • The Solar Explorer
  • Products
    • 2020 Top Products
    • Batteries and Storage
    • Inverters
      • Manufacturing Locations
    • Racking and Mounting
    • Software
    • Solar Panels
      • Manufacturing Locations
  • Leadership
    • 2020 Winners
    • 2019 Winners
    • 2018 Winners
  • Subscribe
  • Resources
    • About SPW
    • Digital Issues
    • Event Coverage
    • Podcasts
    • Product Databases
      • Solar Inverter Models
      • Solar Panel Models
      • Solar Racking Models
      • Battery Storage Models
    • Product Manufacturing Locations
      • Global Inverter Manufacturing Locations
      • Global Solar Panel Manufacturing Locations
    • Suppliers
    • Videos
    • Webinars
    • Whitepapers
  • COVID-19 NEWS

U.S. solar industry surpasses 20 GW of operational solar capacity

By Kelly Pickerel | September 9, 2015

Share

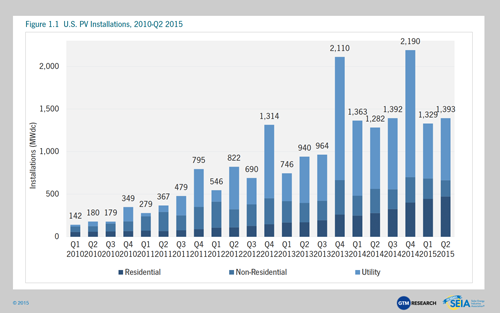
Continuing on its record-breaking trajectory, the United States solar industry surpassed 20 GW of total operational solar photovoltaic (PV) capacity during the second quarter of this year. According to GTM Research and the Solar Energy Industries Association’s (SEIA) Q2 2015 U.S. Solar Market Insight Report, the U.S. installed 1,393 megawatts of PV last quarter, showcasing both annual and quarterly growth.

Source: GTM Research / SEIA U.S. Solar Market Insight

Source: GTM Research / SEIA U.S. Solar Market Insight

The residential solar market set yet another quarterly record in the second quarter. With 473 megawatts (MW) installed, the segment grew 70 percent year-over-year. On top of that, the residential market is diversifying, with 10 states each installing more than 10 MW in the quarter. This shows significant growth from the same quarter of 2013 when only 4 states installed that much residential solar.

The non-residential market finished the quarter down 33 percent from the same period last year. However, the ongoing growth of community solar across the U.S., along with improving market dynamics in several states and continued financial innovation, suggest stronger growth in this segment in the second half of 2015 and beyond.

According to the report, 729 MW of utility-scale solar PV came on-line in the second quarter of the year, representing more than half – 52 percent – of the nation’s quarterly total. With the federal solar Investment Tax Credit (ITC) scheduled to drop at the end of 2016, utility-scale development is at an all-time high with more than 5 GW of capacity currently under construction.

Source: GTM Research / SEIA U.S. Solar Market Insight

Source: GTM Research / SEIA U.S. Solar Market Insight

“The utility PV market continues to be the bedrock driver of new installation growth. And in the second half of this year through 2016, growth will reach new heights as a higher share of what comes online stems from projects procured purely based on centralized solar’s cost competitiveness,” said Shayle Kann, Senior Vice President at GTM Research.

The U.S. installed 2.7 GW of PV in the first six months of 2015. With significant growth expected in the second half of the year, the U.S. is on pace for a record-breaking 7.7 GW year.

“The demand for solar energy is now higher than ever and this report spells out how crucial it is for America to maintain smart, effective, forward-looking public policies, like the ITC, beyond 2016,” said Rhone Resch, SEIA President and CEO. “At over 20 GW of installed solar electric capacity, we now have enough solar in the U.S. to power 4.6 million homes, reducing harmful carbon emissions by more than 25 million metric tons a year. Since the ITC was passed in 2006, U.S. solar growth has exploded and more than 150,000 American solar jobs have been created. By any measurement, that’s a success for both our economy and environment.”

Additional Key Findings:

  • The U.S. installed 1,393 MW of solar PV in Q2 2015, marking the seventh consecutive quarter in which the U.S. added more than 1 GW of PV installations.
  • Q2 2015 was a milestone quarter for the U.S. solar PV market, with cumulative installations eclipsing the 20 GW mark.
  • Throughout the first half of 2015, 40% of all new electric generating capacity brought on-line in the U.S. came from solar.
  • 21 states have now added more than 100 MW of solar PV, but the top five states still account for nearly three-fourths of cumulative U.S. PV installations.
  • 40% of the 16.6 GW utility PV pipeline in development has been procured primarily due to solar’s economic competitiveness with fossil-fuel alternatives.
  • We forecast that PV installations will reach 7.7 GW in 2015, up 24 percent over 2014. Growth will occur in all segments, but will be most rapid in the residential market.

About The Author

Kelly Pickerel

Kelly Pickerel is editor in chief of Solar Power World.

Tell Us What You Think! Cancel reply

Related Articles Read More >

SunPower bringing residential solar services to 7 more US markets
Gov. Cuomo announces over $17 million for New York community clean energy efforts
FIMER rolls out new commercial solar inverters suitable for bifacial applications
New Mexico legislator introduces clean electricity bill to expand on Energy Transition Act

Stay Informed With Great Solar Power Content

Videos Podcasts Webinars Whitepapers

SPW Digital Editions

Solar Power World Digital EditionBrowse the current issue and archived issues of Solar Power World in an easy-to-use, high-quality format. Bookmark, share and interact with the leading solar construction magazine today.

Solar Policy Snapshot

Solar policy differs across state lines and regions. Click to see our monthly roundup of recent legislation and research throughout the country.

Read More >

Popular Posts See More >

Solar investment tax credit extended at 26% for two additional years
The changing state of retiring solar panels
Think before trashing: The second-hand solar market is booming
The winners and losers in U.S. solar manufacturing in 2020
Tweets by @SolarPowerWorld
Solar Power World
  • Top Solar Contractors
  • Solar Articles
  • Top Products
  • Leadership
  • WTWH Media
  • About/Contact Us
  • Advertising
  • Subscribe
  • Windpower Engineering & Development

Copyright © 2021 WTWH Media, LLC. All Rights Reserved. Site Map | Privacy Policy | RSS

Search Solar Power World

  • Home
  • Top Solar Contractors
  • Solar+Storage
  • Articles
    • Most Recent Posts
    • News
      • Latest News Items
      • Solar tariffs
      • COVID-19 News
    • Featured
      • Latest Feature Stories
      • Contractors Corner
      • Installation Practices
      • Trends in Solar
      • Folsom Labs Solar Boot-Up
      • The Solar Explorer
  • Products
    • 2020 Top Products
    • Batteries and Storage
    • Inverters
      • Manufacturing Locations
    • Racking and Mounting
    • Software
    • Solar Panels
      • Manufacturing Locations
  • Leadership
    • 2020 Winners
    • 2019 Winners
    • 2018 Winners
  • Subscribe
  • Resources
    • About SPW
    • Digital Issues
    • Event Coverage
    • Podcasts
    • Product Databases
      • Solar Inverter Models
      • Solar Panel Models
      • Solar Racking Models
      • Battery Storage Models
    • Product Manufacturing Locations
      • Global Inverter Manufacturing Locations
      • Global Solar Panel Manufacturing Locations
    • Suppliers
    • Videos
    • Webinars
    • Whitepapers
  • COVID-19 NEWS