
The U.S. solar industry installed 6.1 GW of solar capacity and had its best first quarter in history, according to the “US Solar Market Insight Q2 2023 report” released today by the Solar Energy Industries Association (SEIA) and Wood Mackenzie. The record quarter was driven in large part by supply chain challenges abating and delayed solar projects moving forward.
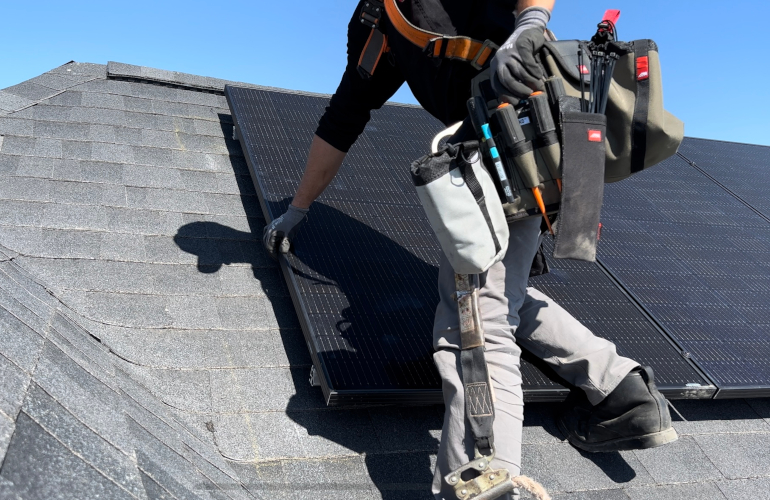
Credit: Solar Goat
Due in part to the strong first quarter numbers and a surge in demand from the Inflation Reduction Act (IRA), Wood Mackenzie expects the solar market to triple in size over the next five years, bringing total installed solar capacity to 378 GW by 2028.
The IRA has also spurred a surge of new manufacturing announcements, with domestic module capacity expected to rise from fewer than 9 GW today to more than 60 GW by 2026. At least 16 GW of module manufacturing facilities are under construction as of the end of Q1 2023.
This quarter, the Biden administration provided some clarity on how the landmark law’s adder credits will be applied. The law contains new credits that can be used in conjunction with the solar Investment Tax Credit, like the domestic content, energy communities, and low-income adder credits. In particular, the energy communities and low-income adder guidance will help drive solar and storage investment in underserved communities.
“As the Inflation Reduction Act begins to flex its muscle and drive demand, the U.S. solar and storage industry is eagerly awaiting further guidance on some of the most impactful pieces of the law,” said Abigail Ross Hopper, SEIA president and CEO. “Timely, specific and workable implementation guidance from the administration will have a major impact on our success in both the near and long-term. This guidance is powerful, and if done correctly, it could unlock new market potential across the country.”
While the IRA has already catalyzed major investments in solar manufacturing and deployment, challenges remain with the implementation guidance for the domestic content adder credits in the near-term.
Because the rules to comply with the domestic content adder credit are complex and there is currently no crystalline silicon solar cell manufacturing capacity in the United States, it could take a few years before the credit can be widely used. The rules also fail to provide specific directions for the residential market, leaving this market segment without clarity.
“The U.S. solar industry is slowly starting to see supply chain relief,” said Michelle Davis, head of global solar at Wood Mackenzie and lead author of the report. “At the same time, qualifying for the domestic content adder will be a very complex process for solar project developers. Even once crystalline silicon cell manufacturing is established, many other components will need to be produced domestically before projects can qualify.”
The utility-scale market rebounded from a difficult 2022 with a strong first quarter and a record 3.8 GW of installed solar capacity. This quarter, more module importers were able to satisfy the documentation requirements under the Uyghur Forced Labor Prevention Act (UFLPA). This enabled more solar equipment to make it to project sites and allowed the industry to build out its long pipeline of delayed projects.
Despite rising interest rates and economic headwinds causing customer hesitancy, the residential segment installed 1.6 GW of solar capacity in Q1 2023, a 30% increase from Q1 last year. The residential market segment is on track to add 36 GW of solar over the next five years, growing at an average annual rate of 6%.
The commercial market also had a record first quarter, with 391 MW installed, putting the segment on track for 12% growth in 2023. Meanwhile, the community solar segment installed 212 MW, a 13% decrease from Q1 2022 due in large part to ongoing interconnection challenges.
By far, Florida was the top solar state in Q1 2023 thanks to 1.46 GW of utility-scale solar installations. Florida installed over 70% more solar capacity in Q1 than the next highest state, California.
Due in part to those installations, the solar industry accounted for 54% of all new electricity-generating capacity added to the grid in Q1.
News item from SEIA


Solarman is 100% correct. SEIA is increasingly and quite quickly drowning in irrelevance in the true Solar + Industry by promoting the Electric Utility Monopoly agenda at the sake of supporting Rooftop. Was a Member for years, tried to help them out, they keep going further down the drain along with the Utility model.
The problem with the EIA, SEIA, Wood Mackenzie , and even BNEF are all utility scale biased reporting. One needs to keep in mind that the utility grid has built in 12% up to 25% power losses in transformer step up and step down losses end to end from (utility scale) solar PV or wind farm generation facility to residential end user. YOU can replace an old coal fired generation plant with a hybrid solar PV and wind farm with utility scale ESS and will still have intrinsic power losses from end to end. Individual, residential and small business solar PV, wind generation and ESS systems distributed are more efficient than utility scale operations. I have NOT come acrossed any energy agency study that looks at the end user loads, the end user on site system and the on site system efficiency over and above the local electric utility feed efficiency of power loss from generation to energy use.
As solar PV panels are being sold with efficiencies of 22% to 24% today and a near future promise of tandem solar PV panels of 30% up to perhaps 40% solar harvest efficiency, the entire energy generation and supply infrastructure is going to be upset as home solar + storage systems become much more efficient than generate and dispatch electricity of the current utility mode of energy sales business model.