
There is a lot to celebrate in the U.S. solar industry, but there’s also a worry that more bad news is coming, this according to the latest “U.S. Solar Market Insight” report released today by the Solar Energy Industries Association (SEIA) and Wood Mackenzie, a Verisk business.
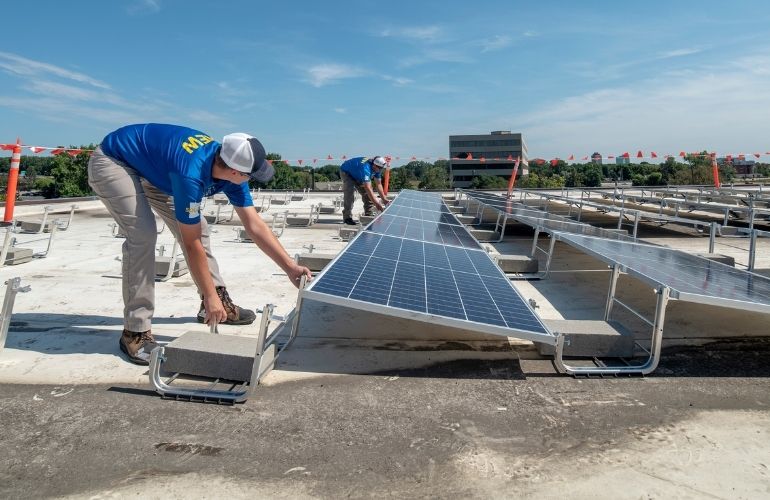
IPS Solar
Solar additions accounted for 56% of all new U.S. electric capacity additions in the first half of 2021, and the industry officially surpassed 3 million solar installations in Q2, driven by a strong recovery in the residential sector after it was hit by the COVID-19 pandemic. Q2 2021 saw the addition of 5.7 GWDC of solar capacity, up from 5 GW installed in Q1.
But supply chain constraints are leading to price increases across every solar market segment. This is the first time that solar prices have increased quarter-over-quarter and year-over-year in every market segment since Wood Mackenzie began modeling system price data in 2014. Prices increased the most for the utility-scale segment at about 6% year-over-year. Many solar developers have sufficient inventory for 2021 projects but will begin to see price increases in 2022, the report says.
“This is a critical moment for our climate future but price increases, supply chain disruptions and a series of trade risks are threatening our ability to decarbonize the electric grid,” said SEIA president and CEO Abigail Ross Hopper. “If we want to incentivize domestic manufacturing and drive enough solar deployment to tackle the climate crisis, we must see action from our federal leaders.”
In addition to recent enforcement actions on Xinjiang metallurgical grade silicon, two new tariff petitions have been filed — one asking for an extension to the Section 201 safeguard tariffs on imported solar cells and panels, and a second asking for a Dept. of Commerce review on Chinese silicon solar panel manufacturing companies working in Southeast Asian countries. Taken together, these actions could significantly exacerbate supply chain constraints and increase solar system prices.
“The solar industry continues to demonstrate strong quarterly growth, and demand is high across every segment,” said Michelle Davis, principal analyst at Wood Mackenzie and lead author of the report. “But the industry is now bumping up against multiple challenges, from elevated equipment prices to complex interconnection processes. Addressing these challenges will be critical to expanding the industry’s growth and meeting clean energy targets.”
New forecasts from Wood Mackenzie show that the U.S. will average just over 29 GW of new annual solar capacity additions through 2026. But this is far short of the deployment pace needed to reach President Biden’s 2035 clean energy targets. To reach these targets the solar industry must install more than 80 GW of solar annually from 2022 through 2035.
The solar industry will continue to set annual installation records until the solar Investment Tax Credit fully phases down in 2024. Industry growth is expected to flatline in 2025 and 2026. These forecasts do not account for additional trade actions, which represent a substantial downside risk to Wood Mackenzie’s outlooks.
Additional insight from the report:
- Residential solar was up 2% over Q1 2021, but up 46% from Q2 2020 when installations were hit hardest by the Covid-19 pandemic. With 974 MWDC installed, volumes were on par with Q4 2020.
- Community solar was up 16% over Q2 2020 with 177 MWDC installed, and commercial solar was up 31% over the same quarter last year with 354 MWDC installed.
- Utility-scale solar set another record for second-quarter installations at 4.2 GWDC. Texas, Arizona, and Florida accounted for nearly 3 GW of the quarterly total.
- A total of 9.3 GWDC of new utility-scale solar power purchase agreements were signed in Q2 2021, bringing the utility-scale contracted pipeline to nearly 85 GWDC.
See the full report at seia.org/smi.


I think another key component in all of this is the BOS items for solar projects. I am seeing constraints and price increases on everything for a solar project. The other big factor is the need for more qualified and trained manpower.
“Many solar developers have sufficient inventory for 2021 projects but will begin to see price increases in 2022, the report says.”
Then there was the story here of 9/9/21 about Heliene bringing another 500MW production to the U.S.. I looked online and found one can purchase a Heliene M72 bifacial panel for $170 or $0.45/watt online. This is 1/3rd the cost of well known panels like LG Chem, Sharp, Panasonic, Kyocera…
This makes me wonder if the SEIA and Wood Mackenzie aren’t biased towards utility solar PV? Then one gets into the “fallacy” of inclusion when one focuses on economies of scale and the “fallacy” of exclusion when one doesn’t try to compare the two different pricing schemes of electricity from the wholesale market to the retail market. Yeah, you can construct very large solar PV farms from about 750MWp to 1GWp for around $1/watt installed and maybe a good deal on a residential solar PV install is around $3/watt to $3.50/watt installed on your home. Depending where one is in the retail electricity market when the cost of electricity is $0.12/kWh or greater, you can install solar PV and pay for the system in 10 years or less. IF you install an EV charging port and use an EV as a daily driver, you can save another chunk of change when NOT buying gasoline every month. Solar PV with EV can pay for itself in energy costs savings in 5 years or less. Comparing residential solar PV installs with utility solar PV installs is also disingenuous. Solar PV is the most efficient installed where the generated power will be used and or stored for later use. Utility scale solar PV farms constructed in the centralized generation with dispatch over power corridors can lose from 12% to 25% of the generated power in transformer step losses along the transmission path. Local distributed generation resources are also more efficient in that the voltage and frequency are already to use in neighborhoods without step transformer losses.