
The U.S. solar industry grew 43% and installed a record 19.2 GWdc of capacity in 2020, according to the “U.S. Solar Market Insight 2020 Year-in-Review” report, released by the Solar Energy Industries Association (SEIA) and Wood Mackenzie.
 For the second year in a row, solar led all technologies in new electric-generating capacity added, accounting for 43%. According to Wood Mackenzie’s 10-year forecast, the U.S. solar industry will install a cumulative 324 GWdc of new capacity to reach a total of 419 GWdc over the next decade.
“After a slowdown in Q2 due to the pandemic, the solar industry innovated and came roaring back to continue our trajectory as America’s leading source of new energy,” said Abigail Ross Hopper, SEIA president and CEO. “The forecast shows that by 2030, the equivalent of one in eight American homes will have solar, but we still have a long way to go if we want to reach our goals in the Solar+ Decade. This report makes it clear that smart policies work. The action we take now will determine the pace of our growth and whether we use solar to fuel our economy and meet this climate moment.”
The 8 GWdc of new installations in Q4 2020 marks the largest quarter in U.S. solar history. For perspective, the U.S. solar market added 7.5 GWdc of new capacity in all of 2015. New capacity additions in 2020 represent a 43% increase from 2019 and break the U.S. solar market’s previous record of 15.1 GWdc set in 2016.
This is the first time Wood Mackenzie has released a long-term forecast as part of the U.S. Solar Market Insight report series. By 2030, Wood Mackenzie is forecasting that the total operating solar fleet will more than quadruple.
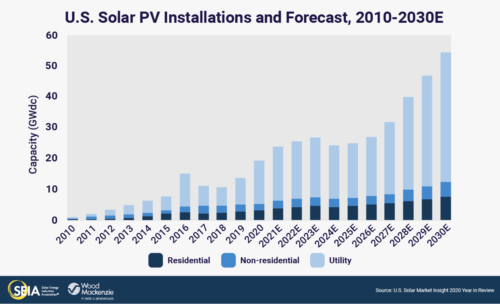 “The recent two-year extension of the investment tax credit (ITC) will drive greater solar adoption through 2025,” said Michelle Davis, senior analyst from Wood Mackenzie. “Compelling economics for distributed and utility-scale solar along with decarbonization commitments from numerous stakeholders will result in a landmark installation rate of over 50 GWdc by the end of the decade.”
California, Texas and Florida are the top three states for annual solar capacity additions for the second straight year, and Virginia joins them as a fourth state installing over 1 GWdc of solar PV. In 2020, 27 states installed over 100 MWdc of new solar capacity, a new record.
Key Figures:
- Residential deployment was up 11% from 2019, reaching a record 3.1 GW. This was lower than the 18% annual growth in 2019, as residential installations were significantly impacted by the pandemic in the first half of 2020.
- Non-residential installations declined 4% from 2019, with 2 GW installed. The pandemic impacted this segment through delayed project interconnections and prolonged development timelines.
- There was a historic 6.3 GWdc of utility-scale projects installed in Q4 2020, bringing the annual total just shy of 14 GWdc.
- A total of 5 GWdc of new utility solar power purchase agreements were announced in Q4 2020, bringing the volume of project announcements in 2020 to 30.6 GWdc and the full utility-scale contracted pipeline to 69 GWdc.
- The 2-year extension of the ITC in the final days of 2020 has led to a 17% increase in deployment in the 2021-2025 forecast.
News item from SEIA


The articles that quote so many GWpdc are often geared towards utility scale projects. A lot of these projects say 500MWp and can power 50,000 homes. If one installed 8kWp on the roofs of 50,000 homes could do the same thing and be more efficient about 20%. Add residential energy storage and the system becomes more self sufficient and resilient the the utility 500MWp system. It seems like in 2016 NREL did a Lidar study on the number of (valid) roofs in the U.S. that could use solar PV for daily energy use generation on site. I believe it was determined there are (67,000,000) roofs that are viable for solar PV installation. We should NOT necessarily be thinking about large utility scale solar PV farms using the argument of “economies of scale” and look at overall efficiencies and resiliency in every community across the country. The next level of application should be housing tracts with community solar PV and energy storage, then look at centralized utility scale solar PV and or wind farms.
What is missing from this very narrative is the interconnection of centralized generation compared to local distributed generation. In the utility centralized business model, one has to site the large solar PV array strings or wind turbines, then (get a transmission line) to areas where the generated energy can be used. It is a relatively well established timeline, new transmission paths take about 10 years from planning to beginning of construction. Building a solar PV farm or wind farm in rural areas, where land is available with “economies of scale” of $1.40/watt down to perhaps $1/watt or less installed does not take into account the cost to get transmission to the end use markets. One can lease or buy property, clear the site and install a solar PV array of several MWpdc, if it will take 10 years to get transmission lines to the site, the investors will bail out and find another project to invest in. The next problem with the utility scale solar or wind farm, is the ‘curtailment’ of these non-fueled assets while forcing electricity prices for each MWh of generated electricity to remain above some set value, say $30/MWh instead of a generate and store operation, the utilities throw away energy to force their fueled generation online for revenue assurances. Just sayin’, you can let ‘them’ (rote IOU utilities) or you can do it and over the long term save money.
This is excellent information for this amazing industry! Growth forecasting helps suppliers predict and plan for better on time delivery of equipment and products!