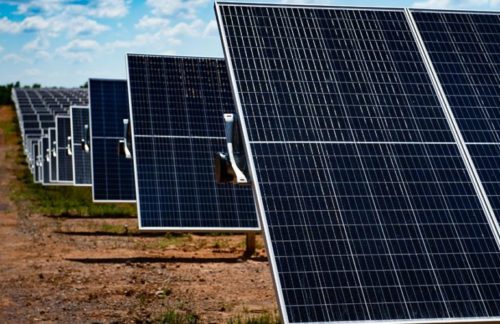
Solar and wind power generation are already off to a great start in 2021, according to data analysis by the SUN DAY Campaign.
The latest issue of EIA’s “Electric Power Monthly” (with data through January 31, 2021) reveals that utility-scale solar thermal and photovoltaic plants produced 23.1% more electricity in January 2021 than they did a year earlier, while estimated small-scale solar (residential) increased by 18.8%. Combined, solar grew 21.7% and provided 2.4% of the nation’s electrical output in the first month of 2021.
Wind also showed strong growth, increasing by 6.6% in January 2021, compared to the first month of 2020, and provided 8.6% of U.S. electrical output. Together, wind and solar increased by 9.5% and accounted for a bit more than 11.0% of net generation in January.
Along with other green energy sources (biomass, geothermal, hydropower), renewables grew by 6.3% and accounted for 20.2% of U.S. electrical production in January 2021 compared to 19.6% the year before.
Meanwhile, FERC’s latest monthly “Energy Infrastructure Update” report (also with data through January 31, 2021) reveals that solar and wind provided all new electrical generating capacity added in the first month of this year. Twenty-seven units of utility-scale solar provided 724-MW while two units of wind added 554-MW.
Renewable energy sources collectively now account for 24.30% of the nation’s total available installed generating capacity and continue to expand their lead over coal (19.43%) and nuclear power (8.50%). The generating capacity of just wind (9.93%) is nearly one-tenth of the nation’s total while wind and solar combined account for 14.46%, not including distributed solar.
In total, the mix of all renewables will add more than 60,976 MW of net new generating capacity to the nation’s total by January 2024 while the net new capacity from natural gas, coal, oil, and nuclear power combined will actually drop by 18,544 MW .
If FERC’s projections prove accurate, over the next three years, renewable energy generating capacity should account for comfortably more than one-quarter of the nation’s total available installed generating capacity — increasing to 28.29%. Wind and utility-scale solar alone will be nearing one-fifth (18.72%) of the nation’s installed generating capacity. Meanwhile, coal’s share will drop to 16.78%, nuclear’s to 7.88%, and oil’s to 2.75%. Natural gas’ share will also decline slightly to 44.14%, compared to 44.43% now.
“The strong growth by solar and wind during the past decade shows no sign of abating with the start of a new year,” noted Ken Bossong, Executive Director of the SUN DAY Campaign. “They, coupled with other renewable energy sources, appear to be on track to providing a quarter of the nation’s electrical generation and possibly a third of its generating capacity within the next five years.”
News item from SUN DAY


“Combined, solar grew 21.7% and provided 2.4% of the nation’s electrical output in the first month of 2021.”
There are those detractors that say, “It’s (only) 2.4% of the nations electrical output.” When one considers over say 15 years with this 2.4% electrical output per (month) has reduced coal from 51% of the generation mix to around 20% nationwide in 20 years. Natural gas generation has increased, but not to the level of coal fired generation in the year 2000. An industry that has relied on fueled generation running 24/7, 365-6 has been king for about 120 years. When collecting and parsing through (data) one needs clear parameter (keys) available. Like the 2.4% claim above, this could also be taken as 28.8% of electricity in a (years) worth of generation. I’d expect to see much more solar PV and wind generation to go online in the next three or four years due to the extension of the ITC. Not taken into account is that even with wind generation, more so with solar PV generation, it is most efficient installed on the property that will use the generation. The price drop of ESS is making the self consumption system a real possibility for many homeowners. From this point of view, individual (micro-grids) won’t show up on utility grid generation statistics, because ‘they’ are no longer in charge of all electricity used in the U.S..
A couple of years ago NREL used Lidar to look at roofs in the U.S. and determined that 67,000,000 roofs are solar PV viable for installation and use of the electricity generated (in situ). Right now for a 480 square foot array on a roof, one could have installed 8.4kWp solar PV system and averaging out this size of system across the U.S. for an (average) of 4 sun hours a day, is about 2.2TW-h a day. All you need is energy storage and a proper distribution network. If this is done locally, then these statistics are skewed once again.