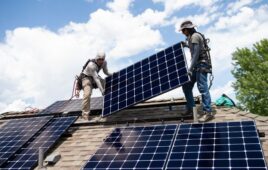
Data just released by the Federal Energy Regulatory Commission (FERC) states that renewable energy sources (solar, wind, biomass, geothermal, hydropower) dominated new U.S. electrical generating capacity additions in the first half of 2020, according to an analysis by the SUN DAY Campaign.
Combined, they accounted for 57.14% or 7,859 MW of the 13,753 MW of new capacity added during the first half of 2020.
FERC’s latest monthly “Energy Infrastructure Update” report (with data through June 30, 2020) also reveals that natural gas accounted for 42.67% (5,869 MW) of the total, with small contributions by coal (20 MW) and “other” sources (5 MW) providing the balance. There have been no new capacity additions by oil, nuclear power or geothermal energy since the beginning of the year.
Of the 1,013 MW of new generating capacity added in just June was provided by solar (609 MW), wind (380 MW) and hydropower (24 MW). These include the 300-MW Prospero Solar Project in Andrews County, Texas and the 121.9-MW Wagyu Solar Project in Brazoria County.
Renewable energy sources now account for 23.04% of the nation’s total available installed generating capacity and continue to expand their lead over coal (20.19%). The generating capacity of just wind and solar is now at 13.08% of the nation’s total and that does not include distributed (rooftop) solar.
Five years ago, FERC reported that total installed renewable energy generating capacity was 17.27% of the nation’s total with wind at 5.84% (now 9.13%) and solar at 1.08% (now 3.95%). Over the last five years, wind’s share of the nation’s generating capacity has expanded by nearly 60% while that of solar is now almost four times greater.
By comparison, in June 2015, coal’s share was 26.83% (now 20.19%), nuclear was 9.2% (now 8.68%) and oil was 3.87% (now 3.29%). Natural gas has shown any growth among non-renewable sources, expanding modestly from a 42.66% share five years ago to 44.63%.
In addition, FERC data suggest that renewables’ share of generating capacity is on track to increase significantly over the next three years, by June 2023. “High probability” generation capacity additions for wind, minus anticipated retirements, reflect a projected net increase of 27,226 MW while solar is foreseen growing by 26,748 MW.
By comparison, net growth for natural gas will be only 19,897 MW. Thus, wind and solar are forecast to each provide at least a third more new generating capacity than natural gas over the next three years.
While hydropower, geothermal, and biomass also are all projected to experience net growth (2,056 MW, 178 MW, and 113 MW respectively), the generating capacity of coal and oil are projected to plummet, by 22,398 MW and 4,359 MW respectively. FERC reports no new coal capacity in the pipeline over the next three years and just 4 MW of new oil-based capacity. Nuclear power is forecast to remain essentially unchanged, adding a net of 2 MW.
In total, the mix of all renewables will add more than 56.3 GW of net new generating capacity to the nation’s total by June 2023 while the net new capacity projected to be added by natural gas, coal, oil and nuclear power combined will actually drop by 6.9 GW.
If these numbers hold, over the next three years, renewable energy generating capacity should account for comfortably more than a quarter of the nation’s total available installed generating capacity.
Renewables’ share could be even higher. Over the past one and one-half years, FERC has been regularly increasing its renewable energy projections in its monthly “Infrastructure” reports. For example, six months ago in its December 2019 report, FERC forecast net growth over the next three years of 48,254 MW for renewable energy sources, 8,067 MW less than its latest projection.
“While the global coronavirus crisis has slowed their rate of growth, renewables, especially wind and solar, continue to expand their share of the nation’s electricity generating capacity,” said Ken Bossong, executive director of the SUN DAY Campaign. “And as prices for renewably-generated electricity and energy storage fall ever-lower, that growth trend seems nearly certain to accelerate.”
News item from the SUN DAY Campaign


Tell Us What You Think!