Local permitting timelines for rooftop solar systems are getting shorter but remain highly variable, according to a new Berkeley Lab study published in the journal Energy Policy. Installers, permitting authorities and policymakers can all play a role in reducing timelines and uncertainty. The authors will be hosting a free webinar on June 18, 1-2 p.m. ET.
Most rooftop solar PV systems require at least one permit, typically from a local building or electrical department. These permits help ensure that PV systems are installed according to local, state and national codes. Permitting processes — while important — increase a customer’s wait time between signing a contract and benefiting from an installed system. Particularly onerous local permitting processes could result in project delays and add costs to PV installations.
While a few studies have explored permitting timelines, relatively little is known about typical permit durations, variation in permitting timelines, and the factors that explain what determines these timelines. The new paper draws on a large dataset of more than 200,000 PV permits, across 368 permitting jurisdictions in 39 states, to provide insights into these questions.
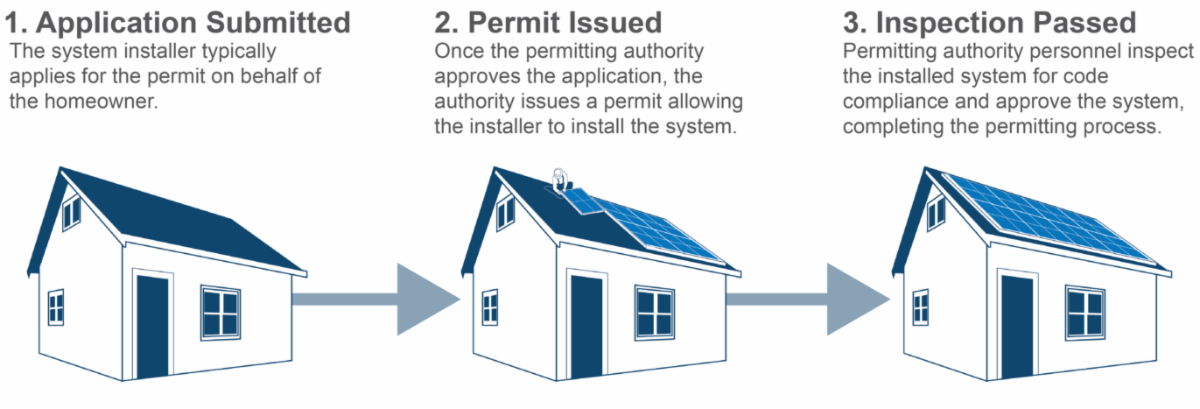
The study explores PV permit durations in terms of the number of days from when an installer submits a permit application until an installed system passes inspection. These durations include the time it takes to install the system. The durations do not include processes associated with the interconnection of installed systems to the grid, which often occur after the permitting process.
Key findings include:
Most PV permitting processes take less than two months, but timelines vary significantly
The research finds that a typical PV permit duration is 50 days at the median. But durations vary significantly: about half took fewer than 27 days or longer than 96 days. At least some of this variation stems from differences across states and local permitting authorities. For instance, permitting durations are shorter in California than in Hawaii, on average, in part due to permit streamlining measures taken in California. There is also evidence that variations in installer strategies account for some of the variation.
Permit durations have declined over time, but not evenly across states
Median permit durations declined from 68 days in 2012 to 43 days in 2018. However, these declines did not occur equally across jurisdictions. Most of the observed decline is due to declining durations in Hawaii and a myriad of other states representing relatively small rooftop PV markets. In contrast, permit durations have remained relatively stable in California — the largest state rooftop PV market. Over time, median permit durations have appeared to converge around 40 to 50 days, suggesting that existing policies may exhibit diminishing returns in terms of reductions in permit durations.
Permitting authority experience and policies could reduce durations
The study finds that PV permit durations are generally shorter in areas where local jurisdictions have implemented measures to streamline permitting — such as California. Similarly, permit durations tend to be shorter in jurisdictions that require a single permit approval rather than approvals from multiple permitting departments. Durations generally decline over time as authorities accumulate more experience with PV permitting. Further, jurisdictions recognized by the U.S. Department of Energy’s SolSmart program are associated with shorter permit application processing times. Finally, more experienced installers tend to have shorter permit application processing times, suggesting that installers similarly learn to navigate permitting processes more efficiently with experience.
Collectively, these results provide evidence that policymakers, permitting authorities and installers could reduce permit process durations by identifying and implementing best practices and sharing experience-based knowledge. Further, the data suggest that reducing duration uncertainty is at least as important as reducing durations in general. Future work could explore measures that could reduce the significant window of uncertainty in PV permitting durations.
News item from Berkeley Lab
This research was funded by the Solar Energy Technologies Office of the U.S. Department of Energy. However, the views expressed in the article do not necessarily represent the views of the DOE or the U.S. Government.


1. In addition, AB 2188 streamlined the permitting process in California. From experience, simply printing out to the correct size, filling in the SLD (Single Line Diagram) form quickly with a pen with the manufacture’s instructions even works well for a retrofit.
2. If this article has placed emphasis only on PV, there is also the factor of ESS systems? At this point, I’m not sure if a diagram with a SLD with AB 546 would continue to decrease the time. However, a simply diagram would increase the understanding and options for homeowners.
BTW, I remember when a permit use to take much longer than four months in 2004.