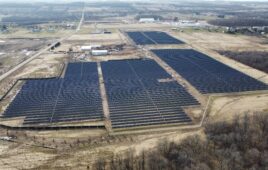
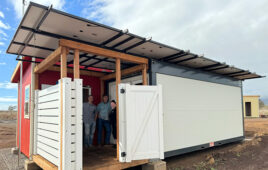
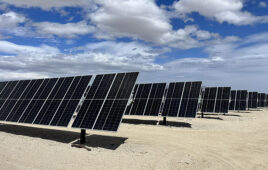
The U.S. residential solar market reached record highs in the third quarter of 2019 with 712 megawatts of solar installed, according to the latest U.S. Solar Market Insight report from Wood Mackenzie Power & Renewables and the Solar Energy Industries Association (SEIA). The U.S. solar market added 2.6 gigawatts of solar photovoltaics in the third quarter, swelling total U.S. solar capacity to 71.3 gigawatts.
The increase in residential installations helped the U.S. solar market grow 45% year-over-year and contributed to 15 states having their best quarter ever for residential solar. States with smaller solar markets such as Idaho, Wyoming, New Mexico and Iowa all saw record residential growth due to continued price declines and improvements to the economic competitiveness of solar across the country.
“This positive report makes clear that American families are demanding energy choice and solar, and that our industry is ready to deliver,” said Abigail Ross Hopper, president and CEO of SEIA. “This is the kind of growth and investment we could see going forward if we make smart policy moves, like extending the solar Investment Tax Credit and stopping additional tariffs. Failure to make these policy moves will limit deployment potential and cost jobs.”
California continues to be the largest residential solar market, installing nearly 300 megawatts in the third quarter of 2019, breaking its own quarterly record.
“While California has always led the country in solar deployment, the drivers behind that growth have shifted,” said Austin Perea, senior solar analyst for Wood Mackenzie. “This is primarily due to new-build solar demand and increased consumer interest in solar + storage solutions as a result of public safety power shutoffs that have left hundreds of thousands of utility customers in the dark.”
According to the report, power shutoffs in California and national coverage of these issues has renewed demand for solar + storage solutions in California and other states across the country.
Wood Mackenzie is forecasting that the total amount of solar installed in the U.S. in 2019 will reach 13 gigawatts, representing 23% annual growth.
Key findings from the report include:
- In Q3 2019, the U.S. solar market installed 2.6 GWDC of solar PV, representing a 45% increase from Q3 2018 and a 25% increase from Q2 2019.
- The U.S. saw record-setting residential solar capacity added in Q3 with more than 700 MW installed.
- A total of 21.3 GWDC of new utility PV projects were announced from Q1 to the end of Q3, bringing the contracted utility PV pipeline to a record high of 45.5 GWDC.
- Non-residential PV saw 445 MWDC installed as policy shifts in states including California, Massachusetts and Minnesota continue to slow growth.
- Wood Mackenzie forecasts 23% year-over-year growth in 2019, with 13 GWDC of installations expected. In total, more than 9 GW were added to the five-year forecast since last quarter to account for new utility-scale procurement.
- Total installed U.S. PV capacity will more than double over the next five years, with annual installations reaching 20.1 GWDC in 2021 prior to the expiration of the federal Investment Tax Credit for residential systems and a drop in the commercial credit to 10% (under the current version of the law).
News item from SEIA


““While California has always led the country in solar deployment, the drivers behind that growth have shifted,” said Austin Perea, senior solar analyst for Wood Mackenzie. “This is primarily due to new-build solar demand and increased consumer interest in solar + storage solutions as a result of public safety power shutoffs that have left hundreds of thousands of utility customers in the dark.””
California is pointed out as the “leader” in solar PV adoption, yet there are several States that have been installing solar PV almost as fast as California. These States are not under the “mandate” of 100% by 2045, and pending mandate of “all new housing built” will have solar PV. California will be the “poster child” of policy gone wrong. Already PG&E was allowed to “screw around” for decades, then after the Camp Fire, Paradise became the “Poster City” of what poor O&M looks like after years of neglect. Now PG&E struggling to get out of bankruptcy is allowed to get away with the PSPS, not only interrupting power to poorly maintained grid infrastructure, but interrupting commerce in those areas when businesses close down and lose revenues.
The 2GW SONGS plant was decommissioned, now in 2023 Diablo Canyon will be decommissioned another approximately 2GW of baseload generation power gone. A total of 4GW of baseload gone in a State with 40 million customers. This “problem” is so (manifold), it will be interesting to see what happens in the construction que through 2025. Here we have PG&E shutting down power to keep their lousy infrastructure from starting another wild fire. PG&E loses revenue when it shuts down power to ratepayers and the ratepayers lose money when food spoils, they can’t go to work because there is no power and wage loss an effect on the local and regional economy. Then during these large brush strokes called the PSPS, how does CAISO react to having 1 or 2 million people’s power shut off and what happens to the fueled generation peak demand generation CAISO contracted with to ramp around grid demands? If 1 million people are affected by a PSPS for a day or more, that’s curtailment of fueled generation on the order of maybe on average 1.5GWh contracted for and lost while the PSPS is in effect?
@Kelsey Misbrener, do you have insight into just exactly how CAISO “contracts” with other generation resources to shore up the California grid on the spot market? Things like, if a peak demand contract is agreed to and then the power drops out and the extra generation is not needed, does the utilities still have to pay for the full term contract even though the power will not be needed or used?