
By Charlie Seltzer, Regional Sales Manager, CivicSolar
Cities across the country have pledged to achieve ambitious renewable energy goals and mandates, but how important will residential rooftop solar be to reach these goals? A report from Cape Analytics found 1.8% of homes across the 21 largest metro areas have installed solar[1], with Californian cities showing significantly higher penetration rates than everywhere else. Residential rooftop solar’s significance to the local energy mix depends on location.
To come up with realistic goals, cities need to determine a reasonable rooftop penetration rate range for their metro area. Economics are the main factor driving residential rooftop solar adoption, so cities should asses the local electricity price, electricity consumption and net-metering policies (NEM) when setting their goals. If a city has an average electricity price higher than $.15/kWh and/or average household annual kWh consumption more than 12,000 kWh, then rooftop solar should pencil out[2] if there’s a good[3] NEM policy and more than 5 kWh/kW of sun hours per day. Cities that have these characteristics should expect and pursue good penetration rates.
For states with great rooftop potential[4], 10%+ penetration rate in the next 10 years and then 25% by 2040 are attainable. The big caveat for rooftop (and DG ) solar is oversaturating the grid and that question depends on the specific utility. The now well-known “duck curve” shows that regions with meaningful solar generation[5] can destabilize the grid. This has led to utility companies adjusting solar export credits and requiring that grid operators can either power-down or curtail power of new interconnected PV systems.
The chart below shows current penetration rates and 2030 and 2040 targets[6]. It also shows current owner-occupied, single-dwelling homes with solar and desired 2030 and 2040 targets.
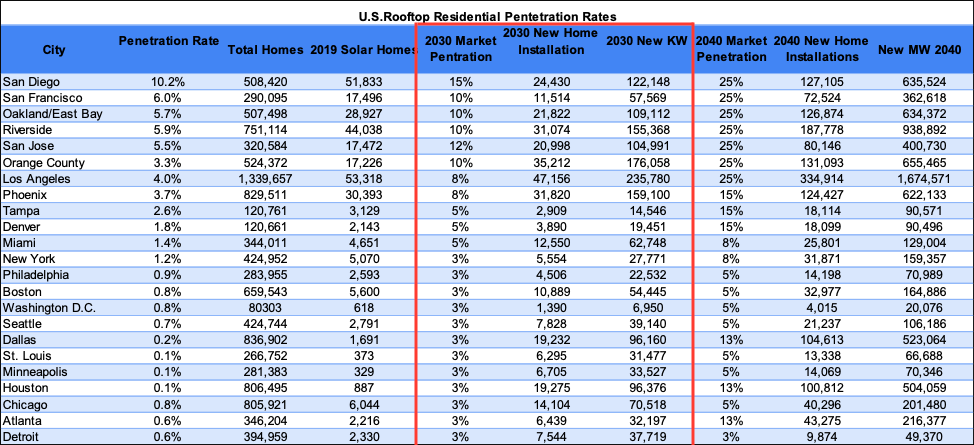
To reach their goals, California cities would need to increase their installations by 50% and the other states would need to more than double their installations. Over the past three years, residential solar has been flat in California and Arizona. By 2030, Houston, Dallas and Chicago should have the most aggressive growth targets of the major metropolitan areas. All three have low penetration rates, but while the city of Chicago has low sun hours, Illinois has strong state policy and good net metering policy.
These penetration rates are not attainable if the grid cannot support Behind The Meter (BTM) residential solar. While different than the rest of the country, Hawaii’s penetration rate was around 15% before HECO shifted to non-export and it is now at 18%. Perhaps some homes in San Diego could pencil with non-export, but there’s not enough sun hours or high enough electricity prices elsewhere to make it work. Exporting to the grid is necessary.
Cities and states that have good rooftop penetration potential such as Texas, Colorado, Florida and Georgia should continue to engage with utility companies and regulators to come up with penetration ranges and NEM policies that reflect those ranges. Furthermore, residential rooftop solar can even help utility companies with peak power.
In addition to NEM, it’s important that these states make sure homeowners have access to third-party ownership and PACE financing — two tools that have contributed to solar’s explosive growth in the past 10 years. Once cities/states have specific penetration targets for rooftop solar and a long-term NEM policy, they should evaluate incentives and rebates too. Even in areas with less rooftop potential, such as Detroit, policymakers should set targets for residential solar penetration. Every watt installed helps cities move closer to their renewable goals.
Footnotes
[1] Neither the report or this article will cover commercial or storage.
[2] Return on Investment, excluding ITC, 7-10 years..
[3] “Good policy” includes annual true-up, 90%+ retail export credit, less than $100 in fixed charges, solar-friendly TOU schedule, minimal Non By-passable Charges, etc.
[4] For more explanation on penetration potential, read here.
[5] Solar power is not the only cause of Duck Curves. Theoretically any power source can create duck curves but renewable sources are less flexible than traditional power sources so duck curves refer to solar and wind power. Duck curve is also not limited to rooftop, DG, solar but DG solar’s export credits has been affected significantly.
[6] A couple notes about the chart. The penetration rate comes from Cape Analytics report; Total number of homes are owner-occupied single-family homes from 2017 U.S. Census, and 2019 Solar homes is combining Cape Analytics report with the 2017 Census data. The new KW installations use an average system size of 5 kW. This chart only focuses on residential, assumes rooftop solar’s current economics, and does not include new home-builds.


Do you have data on residential pv installations for Illinois. IREA promotes renewables in Illinois and as authors of a weekly column on renewable energy for The Rock River Times we encourage residential installations. Having some data for Illinois would be very helpful to us.
Thanks,
Bob Vogl