
For the third year in a row, the U.S. solar industry installed double-digit gigawatts of solar PV capacity, with 10.6 GW coming online in 2018.
The amount was a 2% decrease from 2017. However, the forecast shows the market rebounding in the years ahead, according to the newly released “U.S. Solar Market Insight 2018 Year-in-Review Report” from Wood Mackenzie Power & Renewables and the Solar Energy Industries Association (SEIA).
“The solar industry experienced growing pains in 2018, in large part due to the unnecessary tariffs that were imposed on solar cells and modules, but this report still finds significant reason for optimism,” said SEIA’s president and CEO, Abigail Ross Hopper. “The total amount of solar installed in America is on track to more than double in the next five years, proving solar’s resiliency and its economic strength. It’s clear, this next decade is going to be one of significant growth.”
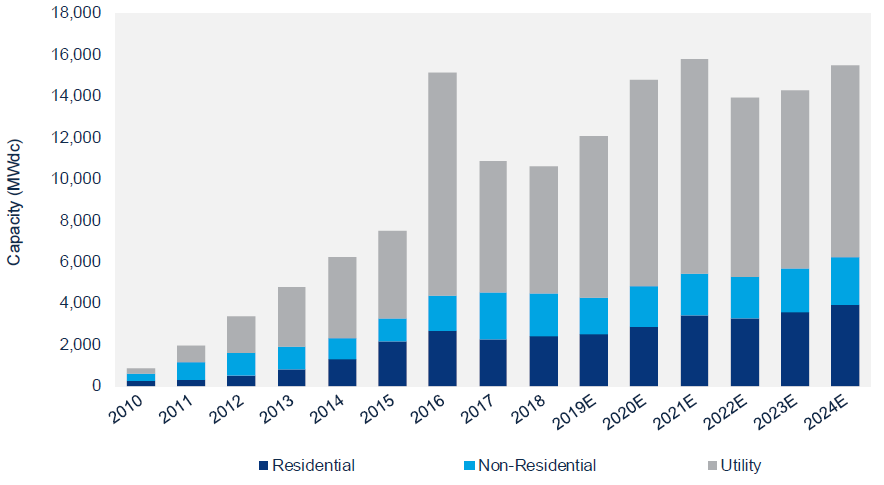
Total installed PV capacity in the U.S. is expected to rise by 14% in 2019 with annual installations reaching 15.8 GW in 2021.
In addition to a market outlook, the report released today also details how the industry performed in 2018 in each segment.
FIGURE: U.S. PV Installation Forecast, 2010-2024E
Wood Mackenzie Power & Renewables
In 2018, non-residential PV saw an annual decline of 8% due to policy transitions in major markets. Utility-scale solar underwent a 7% contraction in 2018, largely related to Section 201 tariffs.
Yet, while annual growth fell in both the non-residential and utility-scale solar sectors, residential solar growth stabilized in 2018 after the previous year’s contraction. The U.S. residential solar market has now seen five consecutive quarters of modest growth, and the fourth quarter of 2018 was the largest quarter for residential solar in two years. Nearly 315,000 households added solar in 2018.
“After the residential solar freefall of 2017, growth in 2018 was driven by a more diverse mixture of national and regional installers than in previous years,” said Austin Perea, senior solar analyst at Wood Mackenzie Power & Renewables. “With a pivot toward more efficient sales channels, both national and regional installers exceeded expectations in California and Nevada, which drove the lion’s share of residential growth in 2018.”
Texas and Florida, two states with generally low solar penetration, stood out in 2018, adding more capacity than some of the highest penetration states. These emerging solar markets are poised to become the engines of growth for residential solar in the U.S.
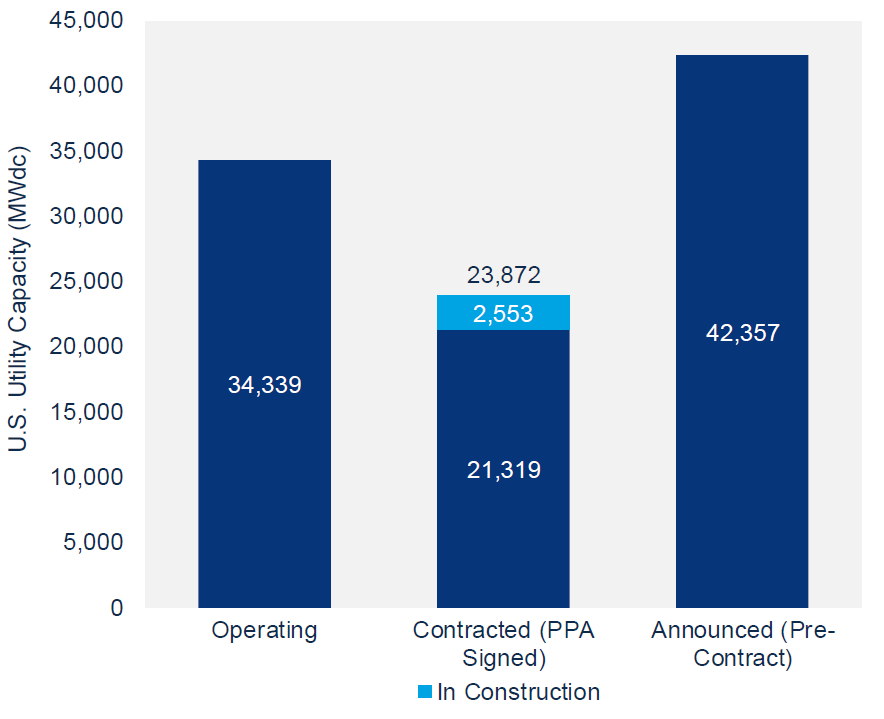
In total, solar PV accounted for 29% of new electricity generating capacity additions in 2018, slightly less than in 2017 due to a surge in new natural gas plants. However, in 2018, 13.2 GW of utility-scale solar power purchase agreements were signed, pushing the contracted project pipeline to its highest point in the history of U.S. solar.
FIGURE: U.S. Utility PV Pipeline
Wood Mackenzie Power & Renewables
Wood Mackenzie also increased its five-year forecast for utility PV by 2.3 GW since Q4 2018. This was the result of a large volume of project announcements, the inclusion of more solar in long-term utility resource planning and an increase in project development driven by renewable portfolio standards and growing corporate interest.
Key findings from the report include:
- In Q4 2018, the U.S. solar market installed 4.2 GWdc of solar PV, a 139% increase from Q3 2018 and a 4% increase from Q4 2017. This brought the annual total to 10.6 GWdc, 2% lower than 2017.
- For the sixth straight year, solar was one of the top two sources of new electricity generating capacity in the U.S.
- Cumulative operating solar photovoltaic capacity now stands at 62.4 GWdc, about 75-times more than was installed at the end of 2008.
- After a year in which residential solar experienced 15% contraction, 2018 marked a year of rebound as the market grew by 7%. Q4 was the largest quarter for the residential solar segment in two years, a sign that the residential market is stabilizing. In total, 314,600 new residential PV systems were installed in 2019.
- Non-residential PV saw an annual decline of 8%, largely due to policy shifts in states like California and Massachusetts.
- There were 6.2 GWdc of utility solar installed in 2018, accounting for 58% of total U.S. annual capacity additions.
- After the uncertainty of the Section 201 tariffs passed, 13.2 GWdc of utility solar PPAs were signed in 2018, though mostly with expected commercial operations dates in years after the tariffs have stepped down. The contracted pipeline peaked in Q3 2018 at 25.3 GWdc, the highest in the history of U.S. solar.
- Wood Mackenzie forecasts 14% growth in 2019 compared to 2018, with over 12 GW of installations expected.
- Total installed U.S. PV capacity will more than double over the next five years, with annual installations reaching 15.8 GWdc in 2021 prior to the expiration of the residential federal Investment Tax Credit (ITC) and a drop in the commercial tax credit to 10% for projects not yet under construction.
News item from SEIA


Tell Us What You Think!