
By Paul Grana, co-founder of Folsom Labs
System engineers can usually be confident that if a system does well in a performance simulation, then the array will perform well in the real world. Engineering tools (like HelioScope) are fairly good at factoring in dozens of inputs to project how an array will perform under real-world conditions.
However, there is one area of system design that can lead to unexpected—and very large—losses: under-voltage. We’ll explain why.
Why under-voltage losses are particularly bad
The unique trouble of under-voltage losses can be understood by looking at a module’s power-voltage curve. In the example below, we all like to picture that the modules will work at their maximum power point, and that the power point is well within the inverter’s voltage and power window:
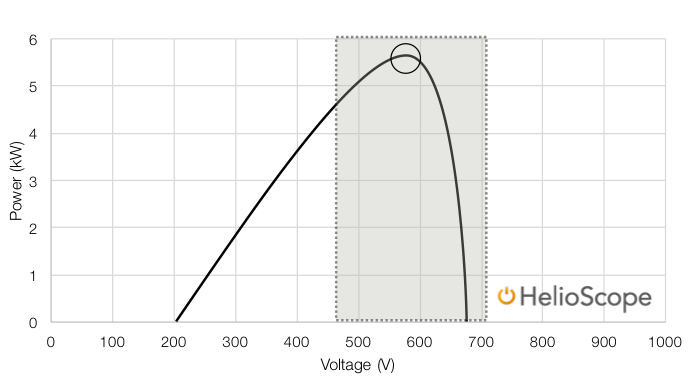
Figure 1: Power-voltage curve
Note, though, how the curve is lopsided – when the modules track to the right side of the curve, power production falls much faster than when the operating point moves to the left side. This difference in power loss corresponds to the difference between under-voltage and overvoltage conditions. In under-voltage conditions, the module’s MPP voltage (the peak of the curve) is below the inverter’s operating voltage window—so the power production drops very quickly. In the example below, a 20% under-voltage gap leads to a 75% drop in production, while a 20% overvoltage gap leads to just a 10% drop in production.
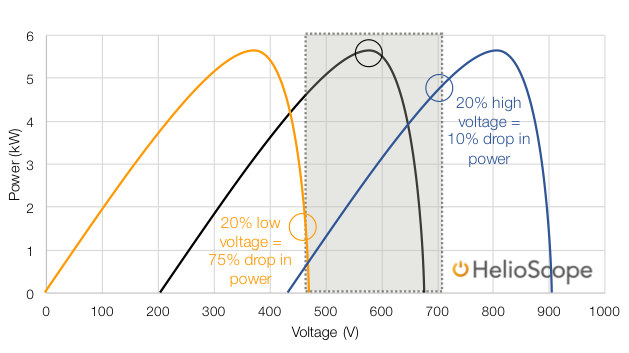
Figure 2: Power-voltage curve, including under- and over-voltage situations
The real challenge isn’t just that these losses can be large—but that they can increase significantly over the life of a system.
Time reduces voltage even further
Everyone knows that modules degrade over time, and most people think of degradation in terms of power. However, power is the product of current and voltage, and degradation losses come from voltage, not current.
So as module voltages drop over time, under-voltage losses will get worse. And as we saw illustrated in the image above, under-voltage losses accelerate quickly as the array is pulled off of its max power point.
Take, for example, an array with a small under-voltage loss in the initial year of design. These initial under-voltage losses of 0.3% might seem acceptable to a system engineer. However, as the modules degrade over time (assuming just 0.5% annual degradation), the under-voltage losses grow faster than the degradation losses. At year 10, the under-voltage losses will be over 5%, while at year 25 the under-voltage losses will be over 20%.
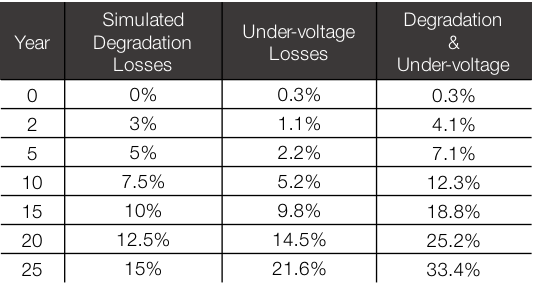
Figure 3: Degradation losses over time
In fact, this increasing stream of loss has a net present loss value of 2%. In other words, while the year-1 losses seem to be just 0.3%, the higher losses in the future are the equivalent of a constant 2% system loss starting in the first year of operation—certainly something that deserves an engineer’s attention.
How to prevent these losses
So what can a system designer do to prevent these losses? First, ensure that the string voltages are at the high end of the inverter’s voltage range, and/or manually raise the minimum string length to account for this future degradation.
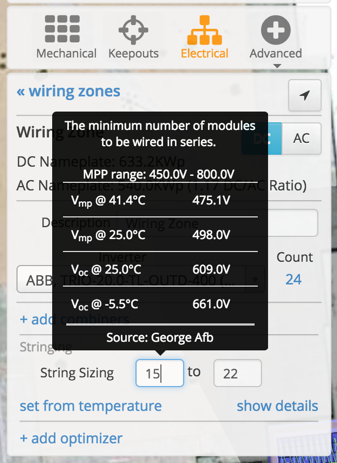
Figure 2: String size calculator
Keep in mind that increasingly, inverters are being sold with narrow voltage windows, as that helps the inverters raise the maximum rated power for the hardware, reducing costs per watt. This raises the risk of future under-voltage losses, even for systems designed at the maximum string length.
Additionally, HelioScope users can double-check a design by running a simulation with an inverter with a minimum MPP voltage that is 10-15% higher than the planned inverter’s minimum MPP voltage. This will show the equivalent under-voltage clipping loss for the array’s future when the string voltage falls by 10-15%.
Finally, O&M providers should consider this voltage degradation when performing inverter replacements. Since the array’s operating voltage falls over time, the replacement inverter installed at year 15 should be designed to a lower voltage range than the one installed on day one.


Much as the first response above i also query the information in this article, comprehensive research at NREL (among others) has revealed its primarily Imp (amperage) and not voltage that degrades over time; and indeed, a source for this articles claim would be highly recommended for validation purposes.
Can you provide your sources for the claim that most of a module’s degradation losses come from the voltage component of the I-V curve?