
How well do you know inverter clipping losses? We’ve previously shown that over-power clipping losses aren’t nearly what most people expect them to be—for a DC-to-AC ratio of 1.2 in Georgia, an engineer can expect clipping losses of just 0.2%.
However, if you talk to enough people, you might hear talk of projects with much higher DC/AC ratios: 1.5, 1.6, even 1.7. These are systems where a 2-MW inverter block would collect 3.4 MW worth of modules. Evaluated solely based on over-power clipping losses, these designs seem foolish. After all, a 1.7 DC/AC ratio will have over-power clipping losses of over 9%. So what gives?
Constraints
To understand how these high-DC/AC-ratio systems pencil out, we must first understand constraints. In solar design, there are a number of factors that might constrain the size of an array. It might be the physical space available on the roof or property, the energy load of the homeowner or business owner, or the customer’s budget. And in some cases, it might be the maximum allowable power injected to the grid.
In the case of constraining energy injected to the grid, this is primarily a function of the grid operator. Utilities and grid operators must manage grids with a host of players—generators, consumers and the hardware to manage those electricity flows. When a solar array gets the go-ahead to connect to the grid, the utility will often mandate the maximum power that will be injected to the grid at any point in time—in other words, the grid may only be able to ‘handle’ a maximum of 10MW of AC power at that location.
Rethinking DC/AC ratio
In a “regular” system (constrained by physical space or by budget), the DC/AC ratio is a tradeoff of clipping losses versus inverter cost. A smaller-capacity inverter will cost less up-front, and may have only a small impact on the energy yield. That was the premise of our earlier article on inverter losses.
However, in a world where the AC power is constrained, the DC/AC ratio takes on a completely different meaning. It becomes a direct proxy for the DC system size. When the AC system size is constant, then the DC system size will have a 1-to-1 relationship with the DC/AC ratio. The DC system size will also have a direct impact on the system energy generation (and therefore the revenue). In other words, in these kinds of systems, while the clipping losses will increase significantly, the marginal revenue can be worth it.
Putting the concepts in practice
In the example below, we can see that when increasing the array size from 11 MWdc to 18 MWdc (with a 10 MWac inverter capacity), the energy yield grows from 17,000 MWh/year to over 24,000 MWh/year. Over that same range, the clipping losses increase from 0% to over 10%.
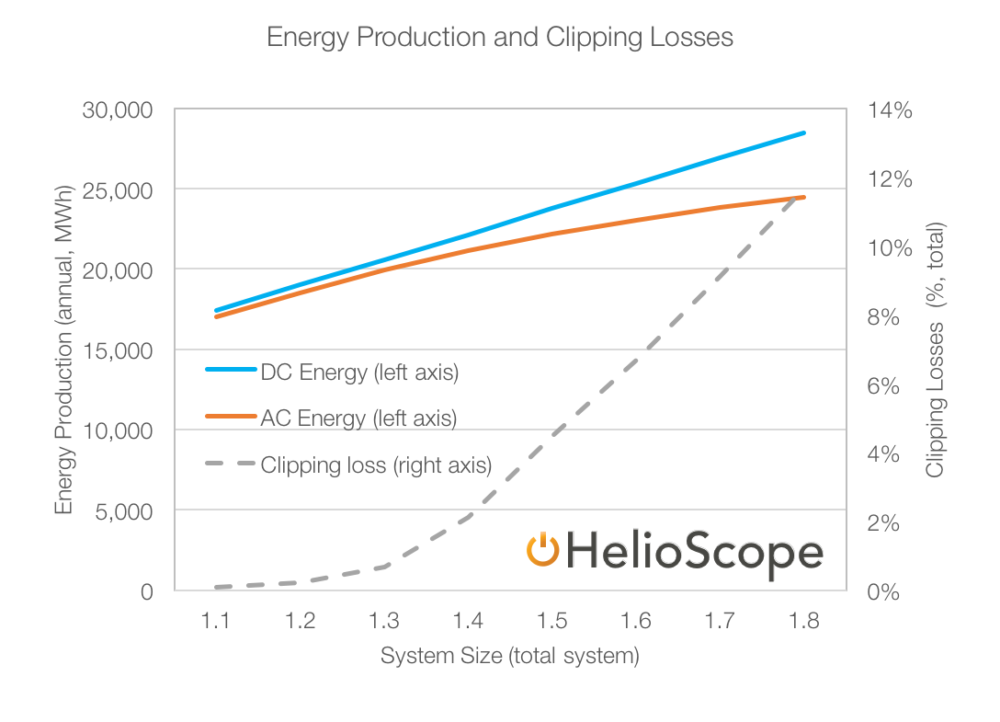
Figure 1: DC Energy and AC Energy based on System DC/AC Ratio
The above clipping losses (over 9% at a 1.7 DC/AC ratio) are at the total system level—if we isolate each megawatt of modules as individual cohorts, then the marginal clipping losses appear much larger—in fact, as we go from a 1.7 DC/AC ratio to 1.8, the marginal 1 MW of modules has clipping loses of nearly 60%!
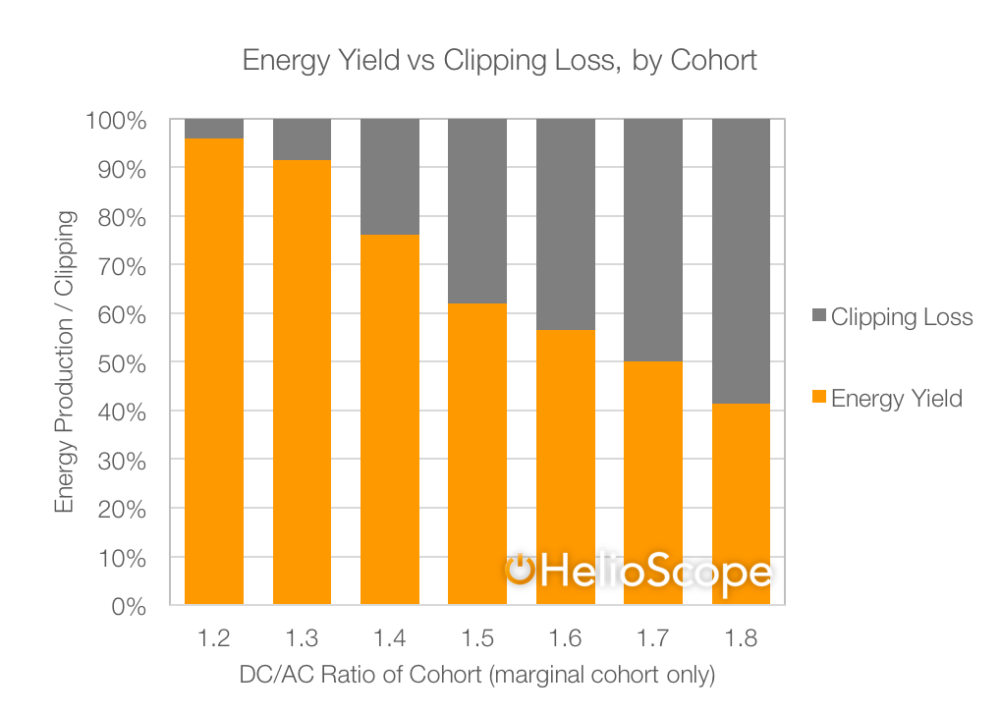
Figure 2: Clipping Losses by Module DC/AC Cohort
But the more actionable way to think about each cohort isn’t the clipping losses, but the total energy generated. And in that view, even a megawatt worth of modules with 50% clipping losses would generate 800 MWh of energy per year. By applying typical cost & revenue assumptions, we can see the dynamic: each group of modules costs the same to install (since each one requires the same amount of modules, racking, wiring and labor), while the revenue generated by each cohort drops (as the clipping losses increase).

Figure 3: Revenue and Costs per Module Cohort
Viewed in this way, the optimization tradeoff becomes relatively clear: designers of AC-constrained systems can add modules (increasing the DC/AC ratio) until the added revenue falls below the added cost—and in these situations, it is reasonable to see an ‘optimal’ DC/AC ratio of 1.5 or greater.
Sensitivities
Note that cheaper hardware pushes the optimal DC/AC ratio up. For example, in the chart above, we used a DC price of $0.70/watt (again, that is for modules, racking, wiring and labor, but NOT inverter or fixed/overhead costs). In that scenario, the profit-optimizing DC/AC ratio was 1.6. However, if the DC costs were $1.10/watt, then the optimal DC/AC ratio would be just 1.3.
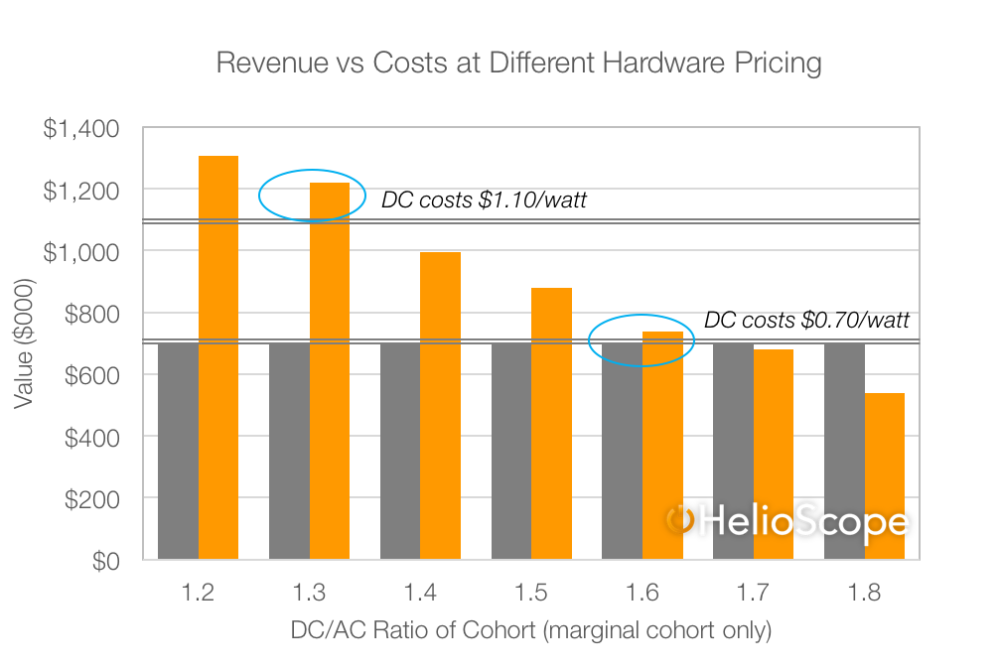
Figure 4: Revenue & Cost Sensitivity to Installed Cost
Of course, system costs (and utility rates) are constantly changing—so the results of this analysis can change significantly based on the cost or revenue assumptions, as either/both of the curves can move up or down.
Also, note that the energy losses shown above are losses just in the first year. Over time, system degradation will mitigate the losses—after the system degrades, the clipping losses will be even lower. So this factor would actually push the optimal DC/AC ratio slightly higher!
Finally, it is also interesting to look at the days/times when the marginal energy is created in these high inverter loading designs. The baseline design has a fairly normal production profile (the maximum production in the summer mid-day):

Figure 5: Time of Energy Generation, 1.2 DC/AC Array
However, if we again isolate the marginal modules that are added as we go from a 1.5 to a 1.6 DC/AC ratio, we can see that the production is by-and-large coming from the morning and afternoons. This is because the summary mid-day production hours are already close to being maximized, and so most of the energy generated during those times is lost due to clipping:

Figure 6: Time of Energy Generation, 1.5 DC/AC Module Cohort
Ultimately, these high-DC/AC ratio modules are not necessarily more valuable (in terms of the day/time of production) than the baseline array. When we applied TOU pricing from a few different tariffs, the relative value of these two profiles (the baseline and marginal modules) is nearly identical, as the extra production in the valuable summer afternoon is offset by extra production in the low-value wintertime.
Summary
When a solar array is constrained by AC size, the DC/AC ratio (and therefore the DC nameplate system size) is a critical design choice. And importantly, because it translates directly to revenue, these kinds of systems will often call for much higher DC/AC ratios.
Epilogue: It is important to note that many inverters have constraints to the maximum DC power they can collect; typically this is shown via the inverter’s maximum rated current. So while we can model 1.7 as easily as we can model 1.2, in the real world, there may be very specific physical limits to what an inverter can handle. You should consult with your inverter manufacturer and ensure you are using hardware that is compatible with the design choices you are making.
By Paul Grana, co-founder of Folsom Labs


That kind of charts could be done with helioscope?
Hi Miguel, sort of: the charts were made in Excel, but all of the data came from HelioScope. HelioScope exports the hourly energy calculations as a CSV file (http://help.helioscope.com/article/164-hourly-report-csv), which would enable you to re-produce all of the charts here on your own if you wanted to. Though sadly, they’re not built into the HelioScope reports as native charts 🙂
Great article Paul, nice research and graphics!