
A white paper provided by WINAICO‘s Tony Chang, Marketing Deputy Manager
The maturing solar industry is beginning to realize solar energy is a 20- to 25-year investment, and solar module reliability is as important as, if not more important than, the power output. Therefore, quality solar manufacturers are integrating reliability testing into the design process, and they use the test results to fine tune module quality during mass production.
One aspect of module reliability is strength against external forces, usually in the forms of human handling, snow and wind. In order to characterize such external forces, quality labs have devised Mechanical Loading (ML), Inhomogeneous Mechanical Loading (IML) and Dynamic Mechanical Loading (DML) tests.
Mechanical Loading (ML) tests as a general test of module strength

Figure 1: Left) ML setup using sand bags to achieve the desired downward force. Right) A simplified force diagram.
ML tests have long been hailed as the de-facto tests for evaluating the mechanical strength of solar modules, especially with IEC 61215 having included the 5,400 Pa requirement for passing the standard. An ML test mounts a solar module flat on a standard mounting system, with 5,400 Pa of weight force placed on top to put stress on the solar module, shown in Figure 1. For a standard 60-cell module, this is equivalent to 916 kg of load on top of a single module. Pictures and power measurements are performed on the module before and after the ML test with the passing criteria of power degradation <5%.
The ML test is easy to set up, and it gives a good indication of general module strength; however, it is frequently mistaken for a test that estimates the reliability against settled snow on a pitched rooftop installation.
Inhomogeneous Mechanical Loading (IML) to test the reliability against snow on pitched roofs
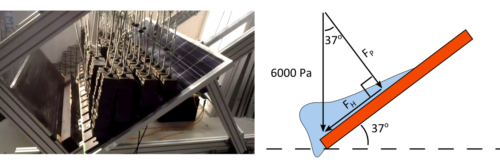
Figure 2: Left) IML setup using even weights on a pitched module installation. Right) A simplified force diagram that simulates the effects of settled snow.
Despite the stringent requirement of modules passing the above 5,400 Pa ML tests, frame breakages due to snow on pitched roofs have become quite common in markets known for long winters, such as Europe, U.S. and Japan. In order to better simulate the mechanical stress of snow settling on pitched residential installations, TUV Rheinland has created the IML test, which is sometimes referred to as non-uniform snow load test. The test begins with 240 hours of Humidity Freeze (HF 10) test on the module, to simulate the freezing conditions. Then a carefully designed set of weights are placed on top of the test module installed at 37° angle. The majority of the weights are located near the bottom frame, with lesser weights toward the top of the module. The result is an uneven distribution of weights spread across the bottom two-thirds of the test module, that simulate the enormous load exerted by settled snow around the eaves, shown in Figure 2.
WINAICO’s standard module has successfully passed the 6,000 Pa IML test with less than 5% power degradation. A closer inspection of the force diagram shows the 6,000 Pa IML force is the vector sum of a 4,792 Pa perpendicular force (FP) and a 3,611 Pa horizontal force (FH). The horizontal force FH directly pushes against the weakest points of the frame, as a pile of snow, pulled down by gravitational force, would. By adding a 1.5 safety factor, WINAICO is certified to withstand 4,000 Pa of non-uniform snow load, a pressure that simulates around 50 cm of settled snow on a pitched roof.
Dynamic Mechanical Loading (DML) to simulate the effects of typhoons
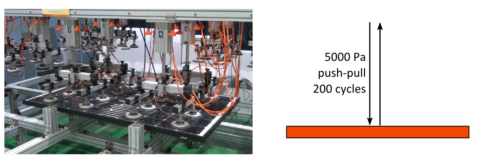
Figure 3: Left) DML setup with computer controlled vacuum cups to provide alternating bidirectional forces. Right) A simplified force diagram that simulates the effects of strong wind.
One area constantly overlooked by the traditional solar markets like Europe, is the effects of strong wind on solar modules due to lack of typhoons and other wind related natural disasters. But as residents of Japan and other South East Asian countries can testify, more than 30% of all tropical typhoons pas through Japan and South East Asia every year. Therefore, a DML test performed by a reputable laboratory becomes a great tool for manufacturers to improve solar modules’ resistance to strong wind. WINAICO has worked with Taiwan’s leading research institute, ITRI, to perform the DML tests. The setup in Figure 3 shows a horizontally mounted solar module joined to 16 computer-controlled vacuum cups. The vacuum cups are programmed to deliver push-pull forces on the module, to simulate effects of strong wind.
Based on ITRI’s extensive research, the test criteria, of 5,000 Pa for 200 cycles, simulates the strongest possible typhoon, which is more than level 17 on the Beaufort scale. With less than 0.29% power degradation, it means WINAICO’s modules can survive in wind speeds faster than 220 km/h, when mounted on equally secure mounting system.
Summary
Due to the nuances in ML, IML and DML tests, the onus is on the manufacturers to understand the target markets’ applications and needs, then choose the right reliability tests to satisfy the customers. The summary of the differences are shown in the table below.
| ML | IML | DML | |
| Setup | 5,400 Pa on a horizontal module | 6,000 Pa unevenly spread on a pitched module | 5,000 Pa 200 cycles with push-pull forces on a horizontal module |
| Practical usage | 916 kg load | 50 cm settled snow | 220 km/h wind |
| Applications | General application | Settled snow on pitched roof | Typhoon prone areas |


It seems one would have the ability to melt snow off upon contact by using available energy delivered directly. Why worry about accumulation at all? Just saying.
Because snow also come in the night and solar panels don’t work in night! And the sun might not show up for the next couple of days after the snow storm.
You would need a built-in heating mechanism with each solar panel, which makes it way more complex and costlier. Also, heating requires some of the highest power input, so you’d end up reducing the panel output for your home even more in winters. Overall a bad deal.
IML test measures the power degradation in the module immediately after the mechanical loading of the module. However there is no indication on the chance of micro-cracks developing in the module after a non-uniform mechanical loading which could lead to a higher power loss in the long run. Isn’t an EL imaging also required to capture the effect of uniform/non-uniform loading on the PV modules? Besides, PV modules operate in real environments where chances of it experiencing point loads is also as high as the instances of uniform loads. Are there any tests to define the allowable point loads on the PV module without having any damaging impact on the cells like micro-cracks?