
Make sure you’re providing accurate payback numbers — or you risk sullying the entire industry

Jeff Spies, vice president of business development for Quick Mount PV and Secretary of NABCEP, will be teaching workshops on solar sales and ethics in March for the AriSEIA Preferred Solar Installer training program and in June at the Midwest Renewable Energy Fair. Additional training and workshops on solar sales and business can be found at www.solarenergy.org.
By Jeff Spies, SPW Contributor
The term “solar black eye” is well known to industry veterans. It refers to a time in the mid-1980s when solar was considered a bad word by most homeowners. Overly attractive solar water heating incentives caused a rapid boom in installations, and hoping to cash in on the gold rush, large numbers of unqualified contractors jumped into the solar installation field. Many systems were incorrectly designed and installed, resulting in complaints of poor performance and roof leaks after a few short years of service. The promise of solar failed to fully deliver, and the industry languished.
Over the next 30 years, the industry evolved and matured. Solar PV systems, in their infancy in the 1980s, became the dominant solar technology as module efficiencies increased, quality improved and prices dropped. Now public opinion has swung again in favor of solar with 90% of Americans in support of the industry. While I am pleased to see this change, I feel compelled to caution my colleagues to avoid tarnishing this newfound public goodwill with unrealistic promises on financial payback.
I regularly see solar proposals promising financial payback times that are 20 to 40% shorter than realistic calculations suggest. Promising 5 to 7-year payback may make it easier to sell systems in the short run, but when solar customers learn actual payback is 3 to 4 years longer than promised, they could feel misled and develop a negative opinion of their solar provider — and thereby damage the entire industry’s reputation.
Calculating Realistic Solar Payback
The factors that most influence payback projections are installation price, incentives, system kWh production, average value of electricity and electric-rate inflation.
Installation Price. System installation price continues to decline throughout the United States. At the time of this publication, residential solar systems are selling for between $3.50 to $4.00/watt in the Phoenix area, and prices in California range between $4.00 to $5.00/watt. Prices are often higher in the less active solar markets.
Incentives, Rebates And Tax Credits. Many utility rebates have disappeared, but they still exist in some areas. A number of states offer tax credits for solar installation, and a 30% Federal Investment Tax Credit (ITC) is available through 2016. If you base the Federal ITC on the net price (after subtracting local, utility, and state incentives), you will likely minimize IRS audit risk.
System kWh Production. Using data collected from actual PV systems throughout the Phoenix area, electric utilities estimate the average PV system will produce 1,600 to 1,700 kWh for every 1,000 watts of DC array size. While some systems may produce more kWh’s in their first year, system efficiency declines with age, and a lower number should be used in payback projections to properly represent the 20-year average. If you produce 1,750 kWh/kW in the first year, a lower value of 1,600 to 1,700 kWh/kW would probably be a better estimate to use for the average production over the first 20 years. In Los Angeles and San Francisco, expect about 1,350 to 1,500 kWh/kw. In Portland and Seattle, the output would be around 1,000 to 1,100 kWh/kW.
Average Price Per Kilowatt-Hour For Grid Power. This can be challenging to calculate in areas with time-of-use, tiered or demand-charge rates. Fortunately, the largest utilities in Arizona provide good estimates on average price per kWh. Depending on the homeowner’s electrical usage habits, the average price varies between 10 to 15 cents per kWh in Arizona.
Electric Rate Inflation. Inaccurate electric-rate inflation projections are the leading cause of inaccurate payback projections. A common misconception is that electric rates have increased 5 to 7% per year for the last 20 years. This is not supported by historical data. Thankfully, there is a reliable trusted data source for electric-rate history at the U.S. Energy Information Administration website. Check under “Detailed average price by state by provider” (form EIA-861).
Over the past 10 years, average U.S. residential electricity rates increased by about 3.5%, and over the past 20 years the rate of increase was a more modest 2% per year. The main reason many payback calculations are overly optimistic is the proposal fails to adjust for inflation. Once average inflation rates are factored in, we find that electricity rates have increased by less than 1% over the past 10 years and, perhaps more interestingly, over the past 20 years electricity rates have actually decreased. Both Arizona and California electricity rates increases have tracked fairly close to the national average.
Example payback calculation for a 4.6 kW grid tie PV system in Phoenix
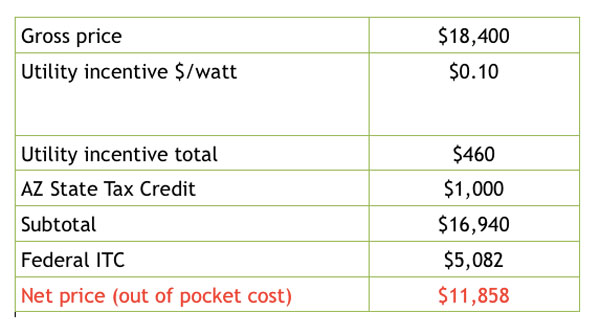
Step 1: Calculate gross installed price
4,600 watt system x $4.00/watt
$18,400 total system price installed
Step 2: Subtract incentive & tax credits for out-of-pocket cost
Utility incentive $0.10/watt
AZ state tax credit – 25% of system cost up to max $1,000
30% Fed Investment Tax Credit (ITC) on “subtotal”
Subtract incentives to get net out-of-pocket price
Step 3: Estimate annual system production
Assume system produces 1,700 kWh/kW/year
4.6 kW array x 1,700 = 7,820 kWh/yr
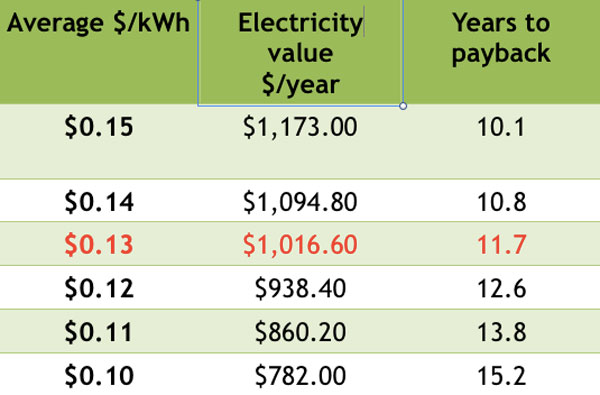
Step 4: Select average electricity value in $/yr:
Assume average electricity price is 13¢/kWh
Therefore, 7,820 kWh/yr x $0.13/kWh = $1,017/yr
Step 5: Calculate payback time
Out of pocket cost = $11,858
System produces $1,017/yr
$11,858 ÷ $1,017/yr = 11.7 years
Faster payback times will result if electricity rate increases outpaces inflation. The above calculations assume electricity rates increase at the same rate as inflation. If electricity rates increase 2% over inflation, payback improves to 10.5 years, and if electricity rates increase 4% over inflation, payback improves to 9.7 years. Recent large rate spikes in markets like San Diego may drive their average rate increase above 3 to 4% for the 20-year period.
Will Future Electric Rates Outpace Inflation? The factors that increase electric rates include government mandates to clean up coal plant emissions, resource depletion, maintenance for the aging grid infrastructure and increased energy demand during peak times. The factors that act to reduce electric rates include lower cost natural gas, economic recession and energy-efficiency programs.
How To Ethically Address Electric Rate Increases. I advise solar sales representatives provide customers with historical electricity rate information, explain factors that increase or decrease rates, show payback for range of rate increases on proposal and then allow the customer to decide which scenario is most likely.
My Personal Forecast is for electricity rates to outpace inflation by 2% in the coming years. If correct, most Arizona solar owners will achieve 9 to 11 years payback, and California solar owners will see payback in 7 to 9 years. When installed with quality waterproof mounts on a new roof, the array should easily last 20 to 30 years, with an inverter replacement in 10 to 15 years, resulting in 30 to 50% savings in electricity costs compared to grid prices. This is a win-win for solar customers and the solar industry. Realistic payback calculations are more than sufficient for successful solar selling, and using this ethical sales approach will help the solar industry avoid another black eye.
Jeff Spies, vice president of business development for Quick Mount PV and Secretary of NABCEP, will be teaching workshops on solar sales and ethics in March for the AriSEIA Preferred Solar Installer training program and in June at the Midwest Renewable Energy Fair. Additional training and workshops on solar sales and business can be found at www.solarenergy.org.


Well everything makes totally sense when someone explained this way to a customer but what about if that customer (me) bought a system that doesn’t produce the amount of energy that the sales rep told me the system was going to.
Add I end up with a system that now I “have” to pay even if is not working properly or performing the way it supposed to.
Fred, I agree that cost to borrow money would be another factor. As one would expect, borrowing to buy a solar system will extend payback time. I will likely add that cost into my next revisions of my “Sales and Ethics” curriculum.
When considering payback it is also only fair and realistic to include the cost of borrowing the money to buy the Solar PV system. Most people do not have the cash to purchase the system outright. The majority of systems are financed.
Excellent article. Solar has so much going for it, overselling is not only dangerous but unnecessary.
Even better, I think as an industry we need to be a little more creative than using the sales techniques used 30 years ago by the thermal industry. If we continue to just make incremental improvements on these old systems and techniques, we’ll never reach adoptions of tens of thousands of homeowners per month. We need to come to the consumer talking to them in the language of the things they value.